

Blame Her: Part II
The media says tariff policy and recession fears are pushing the markets lower. And yet, they don't pay attention to the real driver of boom and bust cycles.

Editor’s Note: In Part II of Blame Her… we explore how President Biden's advisers manipulated the economic cycle. Treasury refinancing actions pushed markets higher in 2024 by encouraging more credit, risk, and debt. Once again, Janet Yellen stands at the center of policies that further devalued the U.S. dollar - this time by a shocking 21% decline in purchasing power in just four years. After reading Part I, I recommend a good scotch to help process these policy decisions.
Dear Reader:
21%.
The U.S. dollar lost 21% of its purchasing power from January 2021 to January 2025.
This decline was the largest depreciation during any four-year presidency in the post-Clinton era.
Why mention the Clinton era?
That is the period when the practice of inflation targeting started.
What is inflation targeting?
It's when the Federal Reserve (America's central bank) tries to ensure prices rise by a specific amount each year.
The current target is 2% annual inflation, which gradually erodes savings, wages, and fixed income. It's like a silent annual tax that benefits Wall Street and Washington at the expense of regular Americans.
Janet Yellen, who served as Fed Chair and Treasury Secretary, strongly supported inflation targeting in the 1990s.
She claimed it would help achieve full employment in the economy.
However, it came with a cost.
To hit that target, the Fed often needs to expand credit and liquidity in the system.
That practice has historically benefited big banks, hedge funds, and political insiders first.
This happens because of the Cantillon effect: When new money enters the economy, those closest to the source benefit first.
This effect is a subject that I covered in Part I.
Inflation targeting has helped fuel a dollar disease that created bad incentives and juiced a financialized economy (while accelerating off-shoring of manufacturing).
It also contributed to a 55% drop in the purchasing power of the U.S. dollar since 1993.
All of this sounds bad, right?
Policies that favor Washington and Wall Street over Main Street?
Complete debasement of the currency?
And - lies and distortions that have followed (with no accountability?)
Well, that’s nothing.
Because what has occurred in the last 24 months is somehow even worse.
Not only is Janet Yellen one of the greatest causes of economic inequality in human history, but she also helped manifest a massive fiscal bubble that is deflating right now, just two years after a previous post-COVID bubble imploded.
If you want to understand why the markets and economy are under pressure…
Let’s explore in Blame Her: Part II.
An Economic Reversion
As an economist, I've studied how business cycles work in America.
A business cycle is simply the natural pattern of economic growth rising and falling over time.
To measure these cycles correctly, we look from "trough" to "trough" - from one economic bottom to the next.
The chart below is an approximation of how a business cycle typically flows.
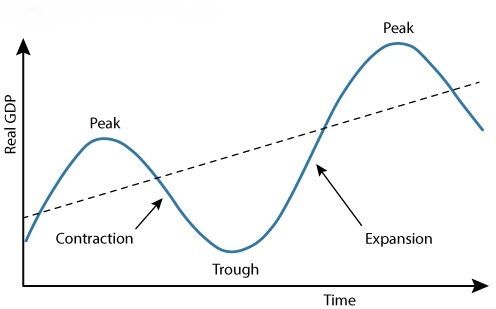
Economic cycles show a growing economy - with the dotted line representing total economic growth over time. But growth doesn't happen in a straight line.
It moves in waves (it oscillates).
Here are the key phases of an economic cycle from a 30,000-foot view.
Trough: The economy hits its lowest point. Unemployment is high, business activity is slow, and growth is minimal or negative.
Recovery: The economy begins to grow again. Businesses start hiring, production increases, consumer spending rises, and confidence returns.
Expansion/Peak: The economy has reached its highest point. Employment is strong, businesses are at capacity production, and growth rates are high.
Contraction/Recession: The economy starts to slow down. Businesses reduce production, lay off workers, and decrease consumer spending, causing growth to stall or turn negative.
Back to Trough: The economy hits bottom again, completing the cycle.
These cycles typically span several years. Each phase can last months or years.
No two cycles are exactly alike. But this pattern tends to repeat over time.
With that in mind, let's go back to March 2020.
You Remember COVID Like Yesterday
You probably remember the worst parts of the COVID market crash.
From our perspective, that economic "trough" bottomed in March 2020.
As the market crashed, we experienced a sharp, dramatic market decline.
The COVID-19 shutdown created fears that the U.S. economy would fall into a recession or even a depression.
At the time, serious concerns emerged about bank failures and commercial real estate collapses.
But here's what most people don't understand about March 2020…
We faced a liquidity crisis potentially worse than the 2008 Great Financial Crisis.
This fear grew daily from late February 2020 to late March 2020.
A liquidity crisis occurs when cash reserves become scarce across financial markets, preventing normal transactions from happening...
In March 2020, COVID-19 lockdowns triggered panic selling of assets while businesses (and individuals) desperately needed to raise cash.
But there wasn’t enough cash. Why is this?
Because of the system’s structure.
The U.S. banking system operates on a leveraged form of finance known as Fractional Reserve Banking.
Under this system, banks don’t have to hold all their customer deposits as cash in their vaults.
Instead, they can lend out a specific amount of their deposits and must hold onto a percentage of them. This percentage is known as the reserve ratio or the reserve requirement.
For example, consider a scenario where a bank has $1 million in deposits, and the Federal Reserve requires 10% of those deposits.
This means the bank must hold $100,000 in reserves.
It can lend out the other $900,000.
However, this creates a multiplier effect.
If that $900,000 is lent out and ends up in another bank, that second bank must keep $90,000 in deposits and can lend out $810,000.
The process continues, creating a highly leveraged cash system.
The practice artificially creates a larger “money supply” than the initial reserves.
There’s a rush to collect cash (those initial reserves) when there's a liquidity crisis.
Markets can and will seize up as everyone looks for dollars simultaneously.
This liquidity problem threatens to collapse the entire financial system unless the Fed or government steps in to bail it out.
And those bailouts happen way more often than you think.
In March 2020, the Federal Reserve provided ample stimulus through Quantitative Easing. In this situation, the Fed buys assets like Mortgage Bonds and U.S. bonds, injecting liquidity (capital) into the system.
It unleashes a massive capital wave that helps reduce default risk in the financial system. New liquidity allows companies and people to pay off debt and refinance existing debt (which reduces the likelihood of mass defaults).
Again, for economic purposes, March 2020 was the BOTTOM of the financial cycle.
With lots of fresh liquidity coming into the system, it provided the necessary stimulus to help boost employment, reduce debts, and ensure that employment wouldn’t crater to “official levels” that we hadn’t seen in decades.
(That said, recall that roughly 23.3% of Americans are underemployed today, according to the Ludwig Institute. We’ve changed the definition of unemployment to suit political purposes for decades.)
Now, what does all of this have to do with Janet Yellen?
Janet Yellen, Keynesian Overlord
Janet Yellen served as Chair of the Federal Reserve from 2014 to 2018 and Vice Chair from 2010 to 2014. Before that, she was president of the San Francisco Fed from 2004 to 2010. She also served on the Fed Board of Governors from 1994 to 1997 and 2010 to 2018. From 1997 to 1999, she advised Clinton as Chair of the Council of Economic Advisers.
She’s straddled the line between central bankers and political advisers for over 30 years. She’s been involved, non-stop, in the economic boom and bust cycles fueled by central banking and fiscal policies for three decades.
Those events include the 1994 Tequila Crisis, the Long Term Capital Management Crash that could have taken down the financial system in 1998, the Dot-Com Bubble, the 2008 Great Financial Crisis, the 2011 European Debt Crisis, the 2015-16 China Crisis, and inevitably the 2018 Bond Crisis.
In 2017, while she was Fed Chair, she laughably predicted that we would never see another banking crisis.
The same month she left the Fed, there was a repo market panic.
But let’s not focus on her central banking career.
Let’s turn our attention to where she married Fed and Treasury policy.
Yellen became Treasury Secretary in January 2021.
By default, she was one of the President’s top economic advisers.
And how did that economy do?
Let’s look at the economy, its performance in 2021, and what happened in the current economic cycle.
The Business Cycle, Interrupted
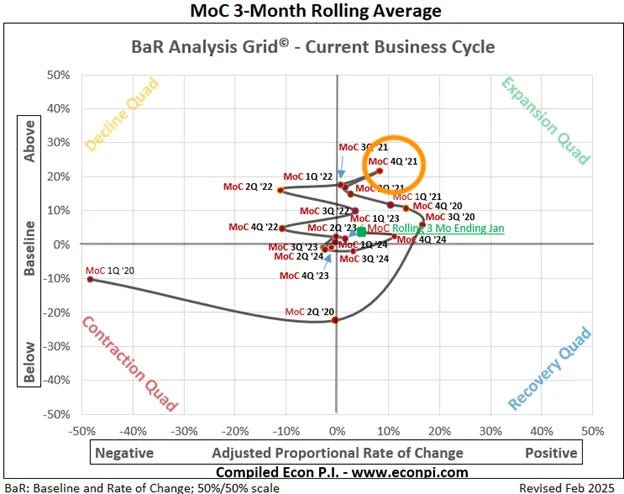
Below is a Quad-Grid analysis of today's key leading and lagging economic indicators.
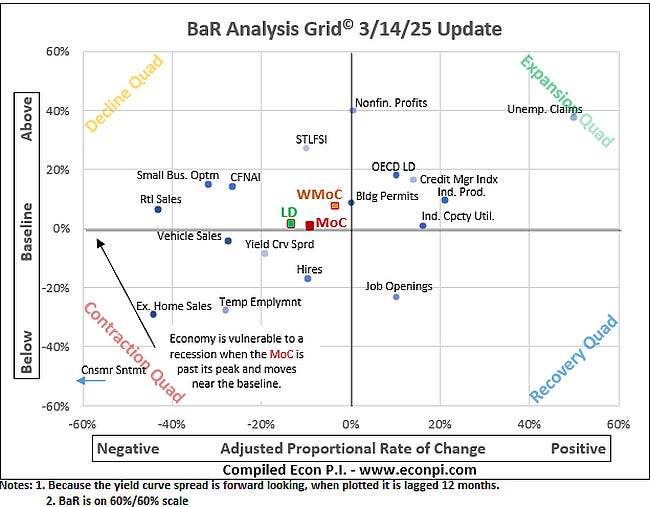
It shows small business optimism, industrial capacity, building permits, unemployment, retail sales, consumer confidence, and more.
These economic indicators are announced by various sources once a month or quarterly and can be seen in the newspaper or on CNBC.
Each indicator can - at any moment - fall into one of four conditions, all aligned with various terms we defined in the economic cycle.
We have Contraction Quad (Trough), Recovery Quad, Expansion (Peak), and Declining (leading to Recession).
These are the indicators as of Friday, March 14, 2025- just a few days ago.
You’ll see that consumer sentiment is in the worst spot of any indicator.
It has contracted sharply, thanks to a slowing economy, weak forecasts, and worries about inflation.
If you look in the Decline Quad, you’ll see a Green dot (leading indicators) and a Red Dot (the “Mean of Coordinates (MoC)” – or the equilibrium of all these indicators).
Leading indicators and the MoC showcase a weakening economic outlook.
That has to be Trump’s fault, right?
Well, you must examine how insane the current economic cycle has been in the last 24 months.
We must examine the three-month rolling average of the Mean of Coordinates from the start of the economic cycle.
And we can do that with this chart. You’ll see that the MoC stars in deep contraction mode in March 2020 - during the COVID crash.
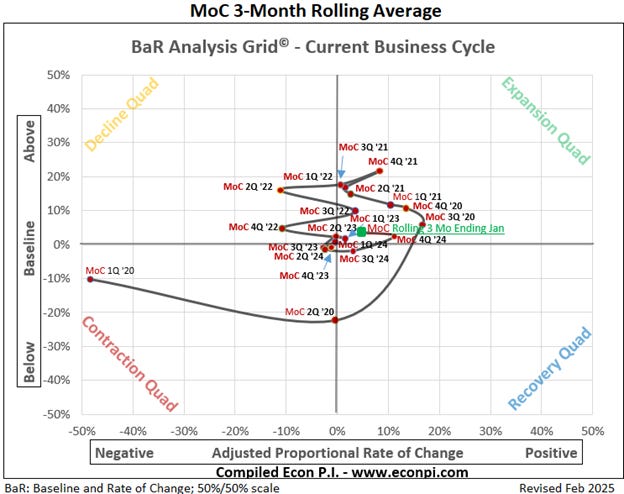
Our current business cycle started in March 2020.
Here’s what’s wild.
We pumped so much money into the economy that we didn’t even have a “Recovery.”
From Q2 2020, we went from Contraction straight to Economic expansion.
That’s what trillions in stimulus will do. T
he MOC went from a contractional change to an outbreak, with above-average growth on the baseline.
In the first quarter of 2021, the U.S. economy was expanding.
That’s important because this is when Yellen entered the Treasury Department.
From March 2020 until late 2021, the U.S. economy expanded (again, due to monstrous levels of stimulus from the Fed, Congressional bailout packages, and COVID-19 relief). These efforts included the American Rescue Plan Act ($1.9 trillion), which injected significant liquidity into the economy.
This was in addition to the $2.2 trillion CARES Act (March 2020) and $900 billion relief package (December 2020), which added more fuel to the fire.
By April 2021, inflation had started to surge.
The U.S. Consumer Price Index (CPI) hit 4.2% year over year. (Biden would blame the first Trump administration for inflation.)
You might recall that the Fed and others thought inflation was “transitory.”
They started using that term not long into the Biden presidency.
A month later, inflation hit 5% YoY, the highest since 2008.
The Fed (and advisors) had dismissed this inflation as temporary, blaming supply-chain disruptions and reopening effects. In August 2021, Fed Chair Jerome Powell, at Jackson Hole, tried again to say that inflation was “transitory,” but then shifted the blame to supply-side constraints (and not, you know, all the money printing).
A month later, in September 2021, inflation hit 5.4%, and investors started to price in the expectation of rate hikes sooner than later.
By November 2021, Powell stopped saying “Transitory.”
But Janet Yellen stuck with the argument… until December 2021 - when she finally capitulated on using the term. Inflation was stubborn and permanent.
The Fed quickly shifted its policies with “transitory” now retired in December.
It would stop the tapering of asset purchases and signal multiple rate hikes for 2022.
The market peaked that month.
The orange circle indicates the period during which the Fed shifted its policies to more restrictive ones.
This period marked a rapid transition from the ultra-accommodative monetary policy that had been in place since the onset of the COVID-19 pandemic.
That Quarter (October to December 2021) aligned with the Peak of that Economic Cycle. See the Orange circle below.
What came next was “hell” for the U.S. stock market.
Understanding 2022
We were in expansion mode in Q4 2021, only to flail back into decline mode.
The MoC would slump toward the Decline Quadrant in Q1 2022 and move into it in that quadrant for the rest of the year (except for a short spike into Expansion mode in Q3, a period driven, oddly, by oil sales from the Strategic Petroleum Reserve).
The economy declined in Q1, Q2, and Q4 of 2022. The government rigged the system by selling U.S. oil to avoid negative growth. We also borrowed at levels (annual deficits) well above the actual GDP growth rate.
This period was also so @#$%@#$ absurd that Biden’s advisors changed the definition of a “Recession.”
During this period, Wikipedia had to suspend edits to its recession page.
Everything was politicized.
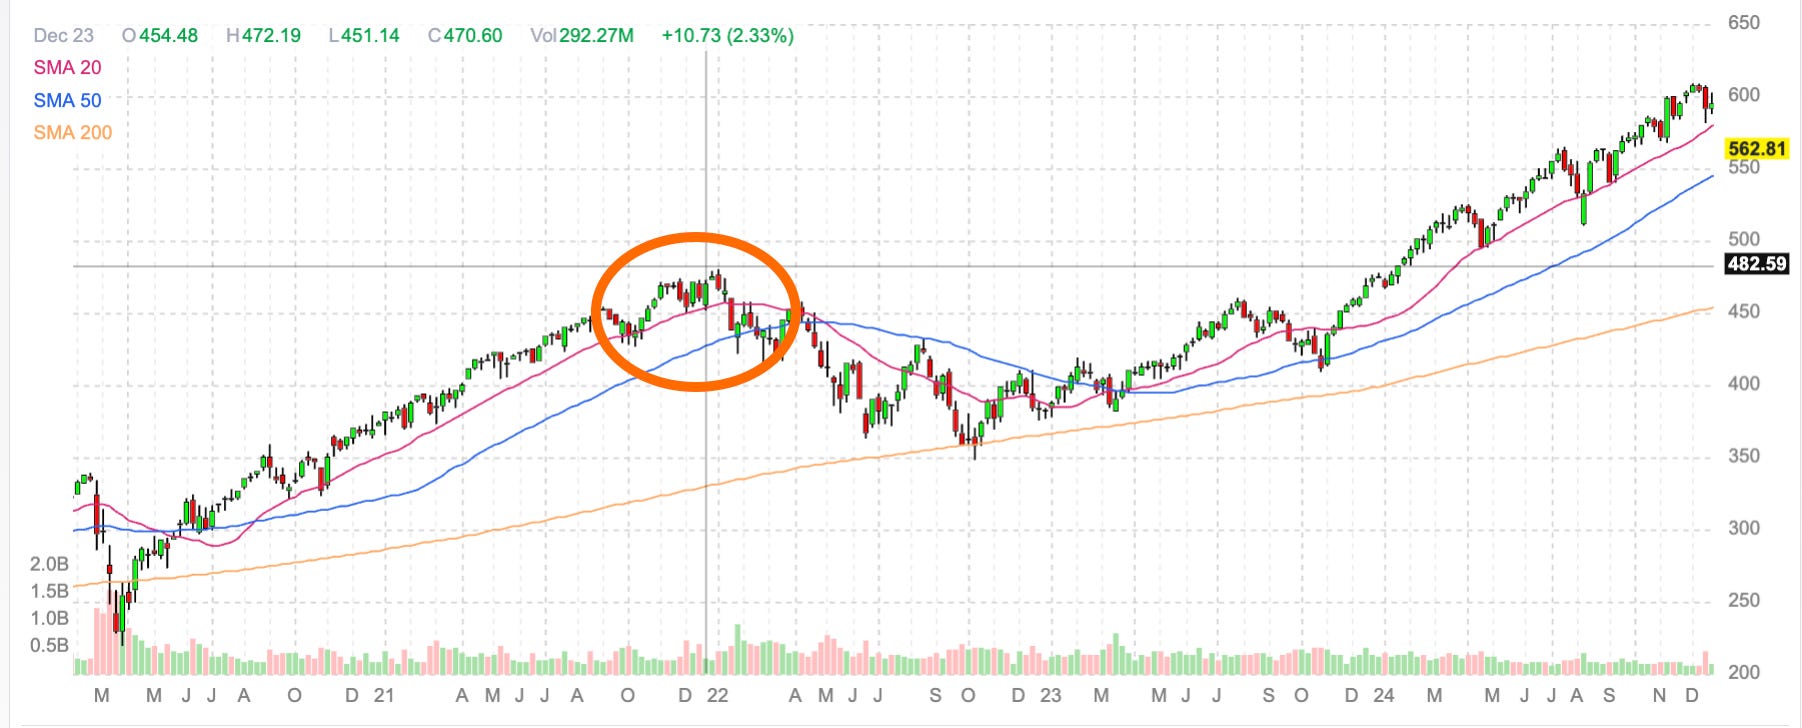
The stock market reacted similarly that year. It retreated in Q1 and Q2 and rallied in Q3 before the inevitable collapse. From January 2022 to September 2022, the S&P 500 fell into a bear market (losses over 20%).
We chopped downward into Q4 2022, only to see the bottom of the liquidity cycle hit in that quarter.
That was when we had the “GILT Crisis” - a massive financial panic in England that nearly sunk the nation’s pension system.
In September 2022, the British pension system faced a liquidity crisis due to margin calls on leveraged liability-driven investment (LDI) strategies.
This was also the market bottom of the liquidity cycle (as defined by CrossBorder Capital) - but most investors would miss what came next.
Wall Street could not have been more cautious heading into 2023.
The S&P 500 entered 2023 at roughly 3,850.
Wall Street banks didn’t examine liquidity; they were naturally focused on earnings growth, valuations, and the economy, not money in the markets.
They ignored the incredible accommodations that would have been made in monetary and fiscal policy worldwide (especially at home) after the GILT Crisis.
Let me explain how liquidity expanded greatly, helping fuel the S&P 500's 24.23% return in 2023 and 25% in 2024.
Cheap Money and Lots of Quantitative Support
In Q4 2022, several accommodative policies kicked in hard for the financial markets.
First, the Bank of England (BoE) intervened with emergency bond purchases to stabilize the pension system and broader markets.
This incident signaled global financial fragility and pressured central banks like the Fed to reconsider aggressive tightening.
After the September CPI report, the S&P 500 bottomed intraday on October 13, 2022.
This coincided with increasing signs of liquidity stress globally, leading markets to anticipate a slowdown in rate hikes.
That’s where the Fed shifted its policies.
Jerome Powell made a significant policy shift during the December 2022 Fed Open Market Committee meeting. At the time, Powell noted that they would hike by just 50 basis points instead of 75 more.
Meanwhile, the Fed’s balance sheet stopped contracting, and reverse repo transactions peaked at the end of the year.
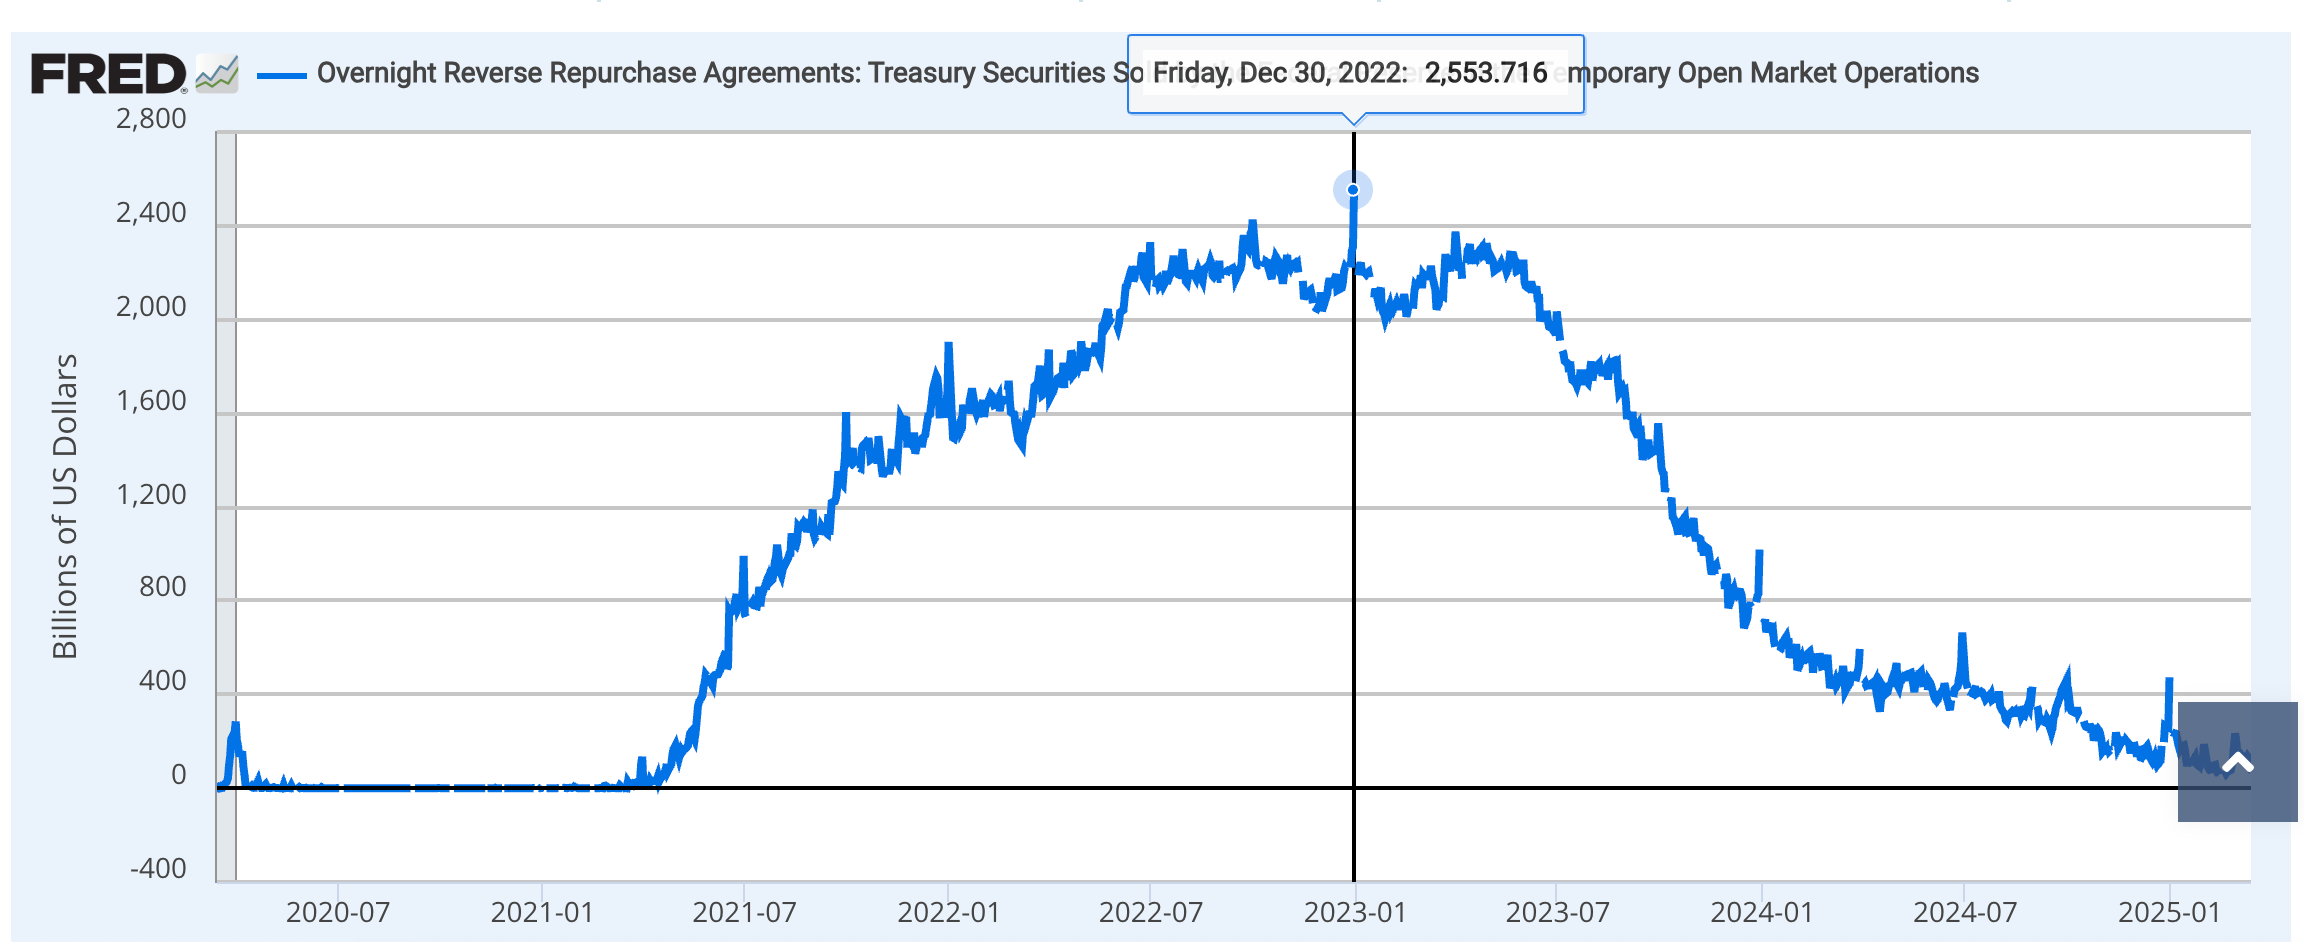
Reverse repo?
Yeah… so here’s how that works. The Fed sells securities to counterparties (such as a money market fund) in a reverse repo.
The Fed then promises to repurchase those assets at a set price and time.
They do this to drain reserves from the banking system.
This helps them control the money supply and thus stave off inflation.
In the Financial Times, when Reverse Repo peaked, Michael Howell at CrossBorder Capital questioned whether “Stealth Stimulus” had returned to the financial system (published Dec. 28, 2022). It had… and most of Wall Street missed it.
Jerome Powell was the Fed Chair, but Janet Yellen at Treasury was the Fed Chair before him.
She understands how this works because she has done it for years. Neither has missed a chance to pump money into the system just for the sake of pumping.
While Powell did all his work (pumping the brakes on the tightening cycle), the second hand reinstated the equity and monetary bubble.
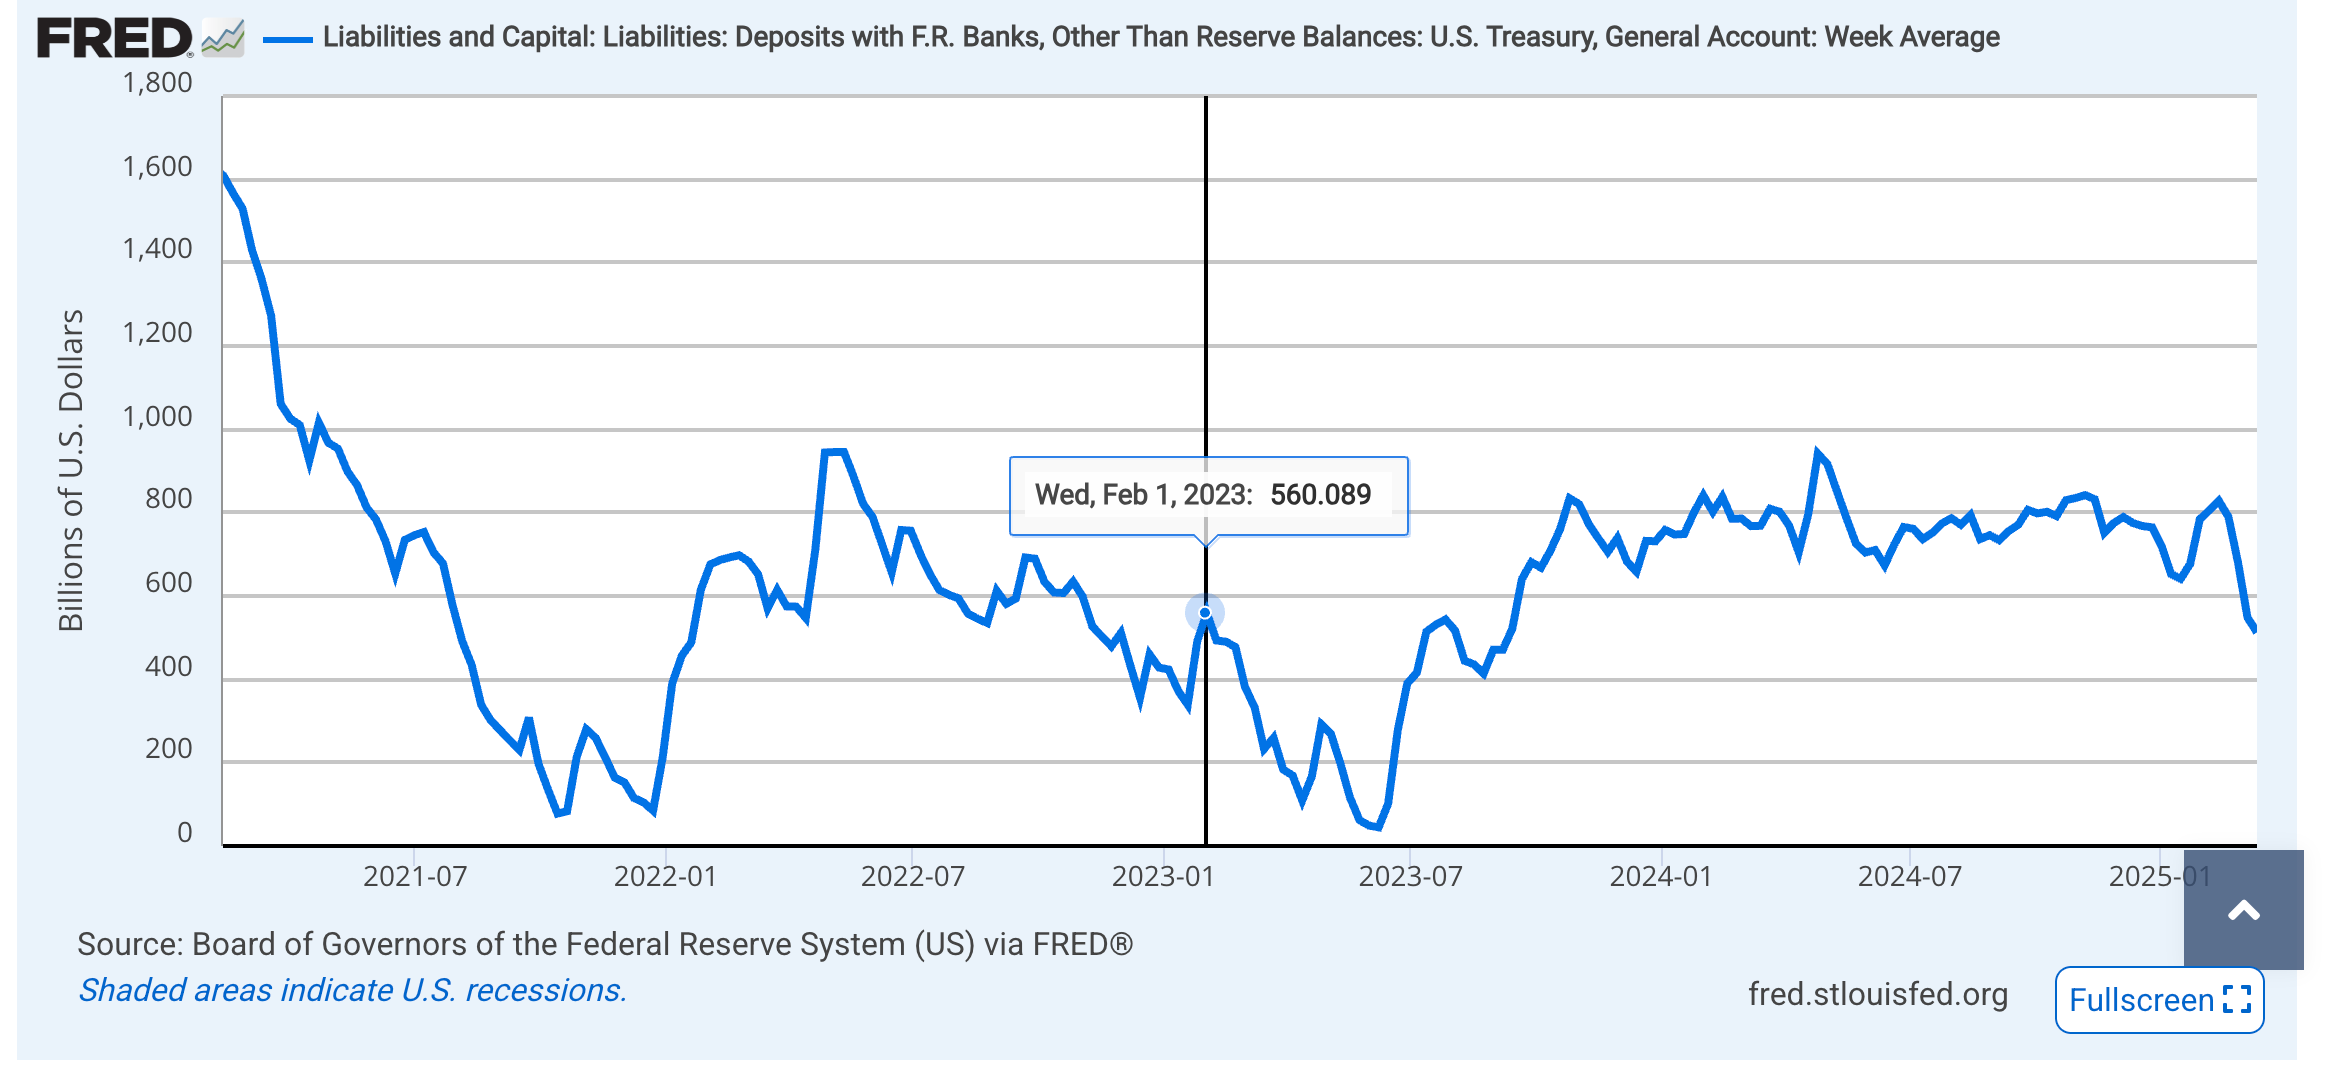
First, Janet Yellen’s Treasury Department started to draw down its Treasury General Account (TGA). The decline in the TGA (in millions of dollars) lasted from $572.6 billion in January 2023 to the bottom in late June 2023, when it was exhausted.
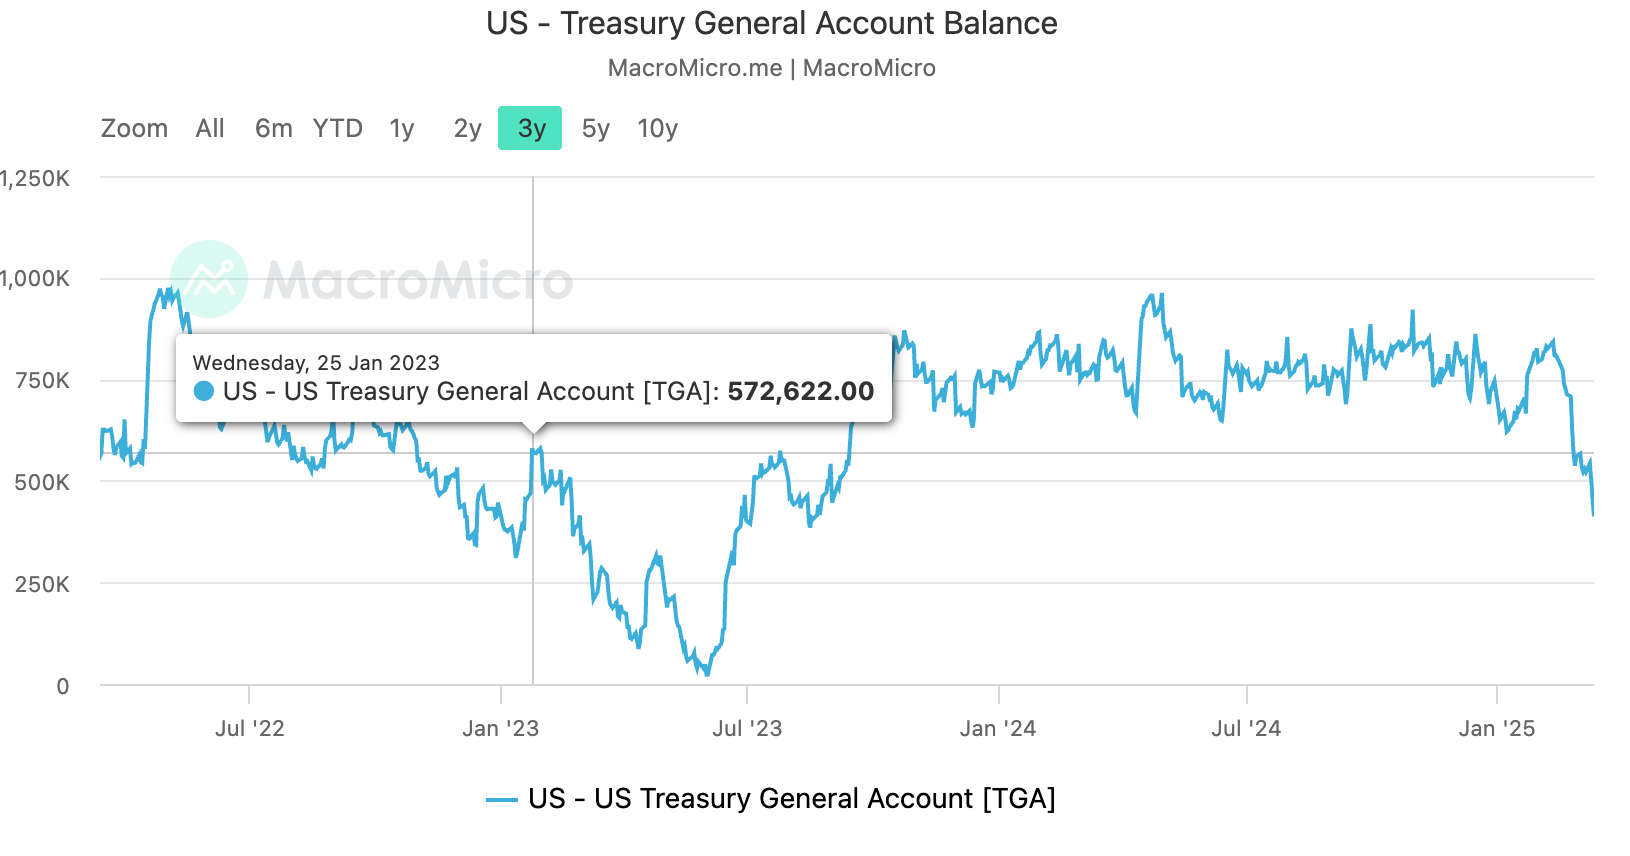
The TGA account is the US government's primary banking account at the Federal Reserve.
This is where tax receipts, Treasury debt sales proceeds, and other government funding are stored and waiting to be spent.
When the Treasury draws down its account, it adds liquidity to the system.
So Janet Yellen added money to the system.
There was another reason to add liquidity beyond the GILT Crisis.
In March 2023, Silicon Valley Bank collapsed.
The Fed made new efforts to support the banking system with new lending programs that it claimed were not stimulus or Quantitative Easing, even though the process added assets to the Fed’s balance sheet.
They just called it something different: the Bank Term Funding Program (BTFP), an emergency lending program that offered emergency lending support. It was totally not a stimulus… and it was totally not a bailout… but a fresh source of capital for the system.
And that - quite frankly - is all that matters.
The Silicon Valley Banking crisis would be a turning point in policy.
This chart - done by Ainslie Wealth - calls the Regional Banking crisis the liquidity cycle trough.
I’d say that it was the GILT Crisis, but we’re splitting hairs here. We need to know that the stock market took off like a rocket after this.
But that period leads us to what is wrong with the current economy.
How Yellen Created the Next Bubble
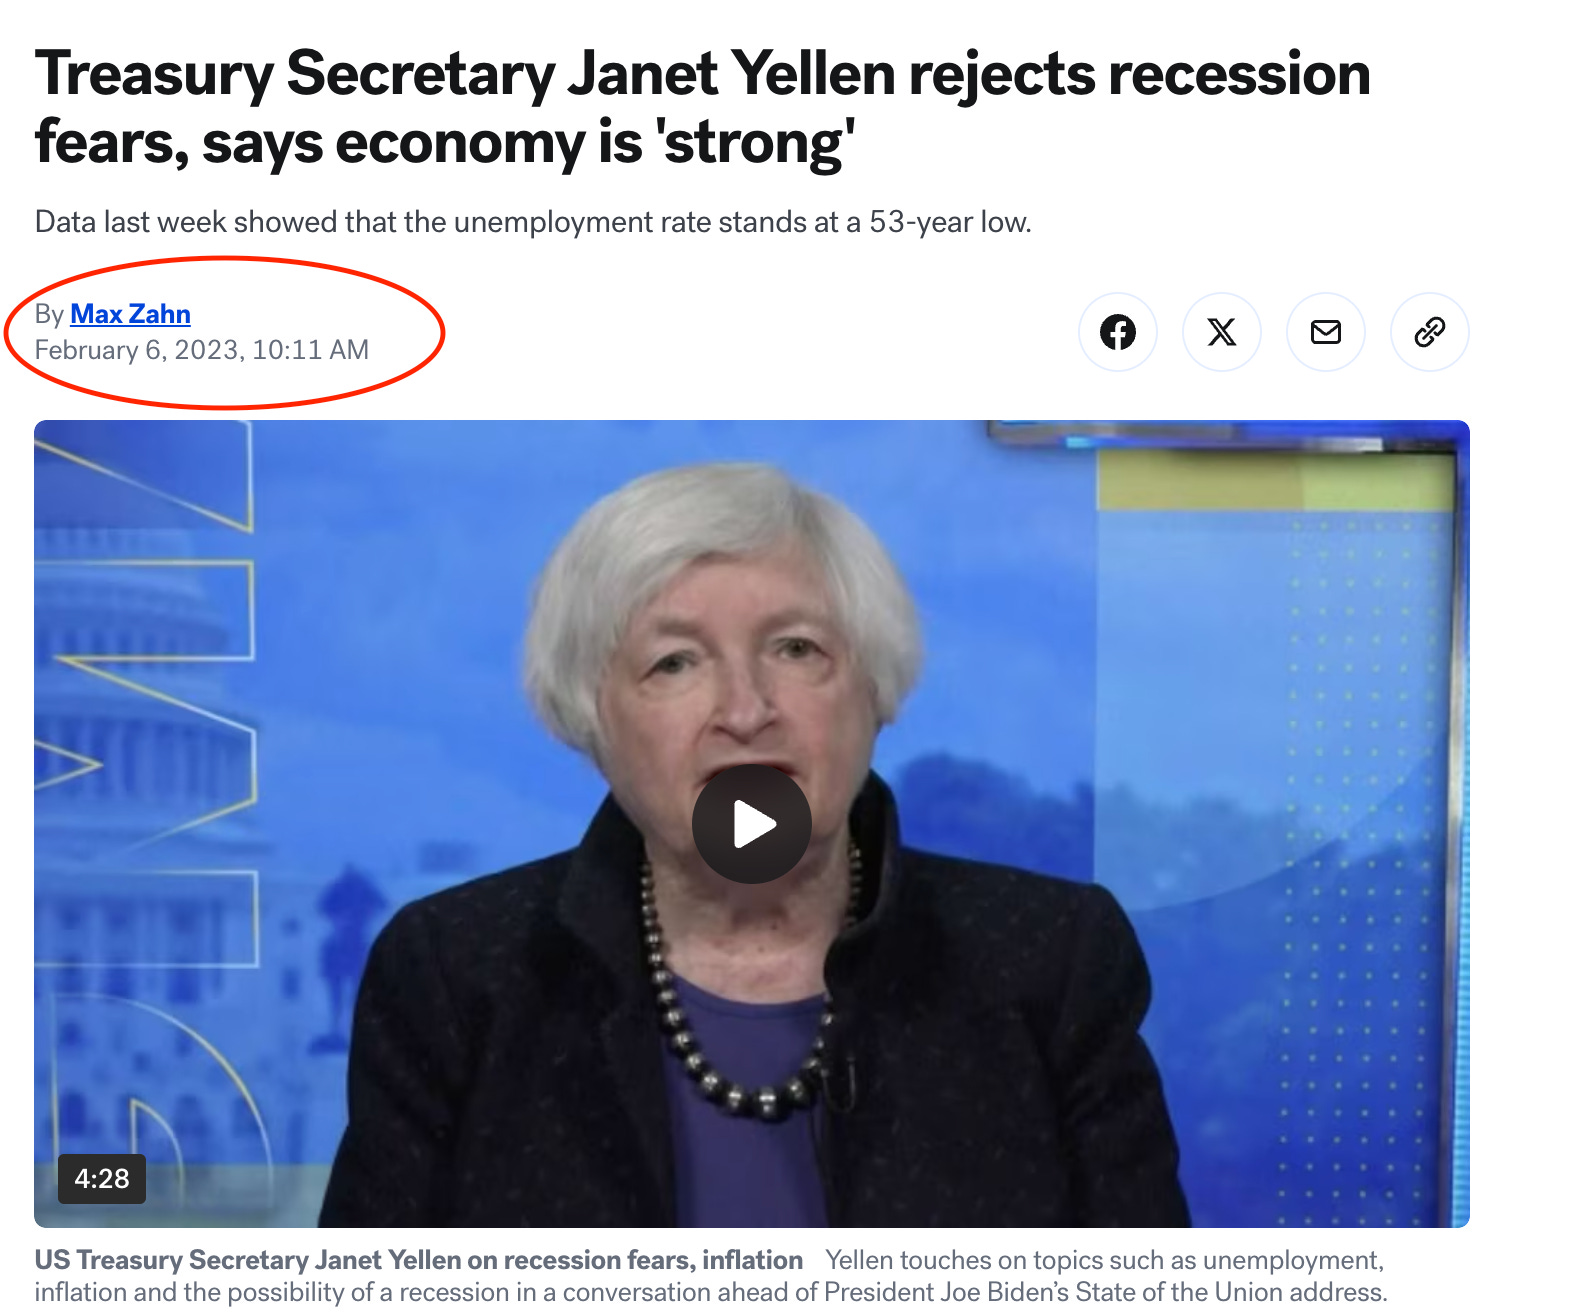
In early 2023, even though the U.S. economy was in decline, Janet Yellen argued that we wouldn’t face a recession.
During that same period, the Treasury had to address its long-term debt obligations and refinance America’s trillions of due debt.
Yellen played politics in May 2023 as concerns about the Debt Ceiling emerged. By mid-2023, the Treasury had run down its General Account.
By May 2023, Yellen was demanding that we lift the debt ceiling so that we could borrow more money.
Why did we need to borrow more money?
So that we could prevent ourselves from defaulting on other bills.
What made you think this system was sustainable?
This was also the point in time where every liberal pundit was suggesting that we just “Mint” a $1 trillion coin and put it in a vault.
Since the money is entirely made up anyway, why not just start really making shit up to avoid a default.
It was impossible to take all of that seriously.
However, it was a consideration because, in the background, financial leaders were still dealing with the challenges that emerged from the collapse of Silicon Valley Bank.
They floated the $1 trillion coin idea to see if anyone in Washington still understood economics and would oppose such insanity.
That said, the economy was not strong. Pay attention to what happens next. The Fed and Treasury Department provided ample accommodation to the U.S. economy.
The MoC dropped from Expansion in Q1, into Decline in Q2, and then Contraction in Q3 of 2023. This is clearly fueled by stimulus.
This is where there’s a serious problem in the underlying economy.

It’s almost impossible to follow this line as it dances like a bubble bee.
Instead of having a nice move of a business cycle, we see incredible chop.
You might recall that Yellen and company refused even to consider the term recession when discussing the economy.
Instead, they’d say the economy was in a state of transition.
It sure would be.
We bounced slightly in Q1 24, contracted again in Q24, ripped back into recovery mode in Q3-24, and expanded in Q4-24.
In a normal economic spectrum, how is this even possible? Well, there was a wall of accommodative policy, which we outlined above.
You just need to see it on a chart to believe it. And you’re about to in a moment.
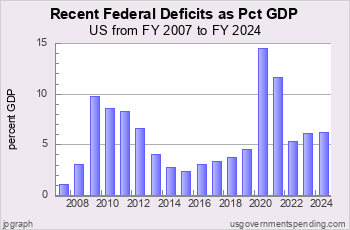
In 2023, the U.S. was only $33 trillion in debt.
And it needed to address trillions of dollars in maturing.
In February 2024, Apollo Academy noted that roughly $8.9 trillion in U.S. government debt would expire in the next 12 months.
Yellen had issues to address in 2023 and 2024, and the bond market had already exploded in late 2023, with the 10-year bond hitting 5%.
When it comes to the U.S. debt, we never pay it off.
We roll it over - or refinance it.
When refinancing, it would make sense to issue long-term debt - say 10 to 30 years.
But interest rates had surged in the previous 12 months.
Yellen couldn’t go that far out on the curve, especially when the 20-year bond hit 5.28% in October 2023. It would return to those levels in January 2025.
Before we get to what she did, recall, in our previous post, that Janet Yellen failed to refinance lots of U.S. debt at MUCH lower rates because their forecasting was so bad.
Instead of issuing long-term debt, the Treasury Department refinanced debt in short-term bills. Bills are debt instruments that expire within 12 months.
The Treasury Department believed that when rates were low, inflation would be “Transitory.” After the period of transitory inflation, perhaps the department could refinance debt once the Fed lowered interest rates.
However, Yellen’s financing plans with short-term bills juiced the economy while reducing pressure on the bond markets.
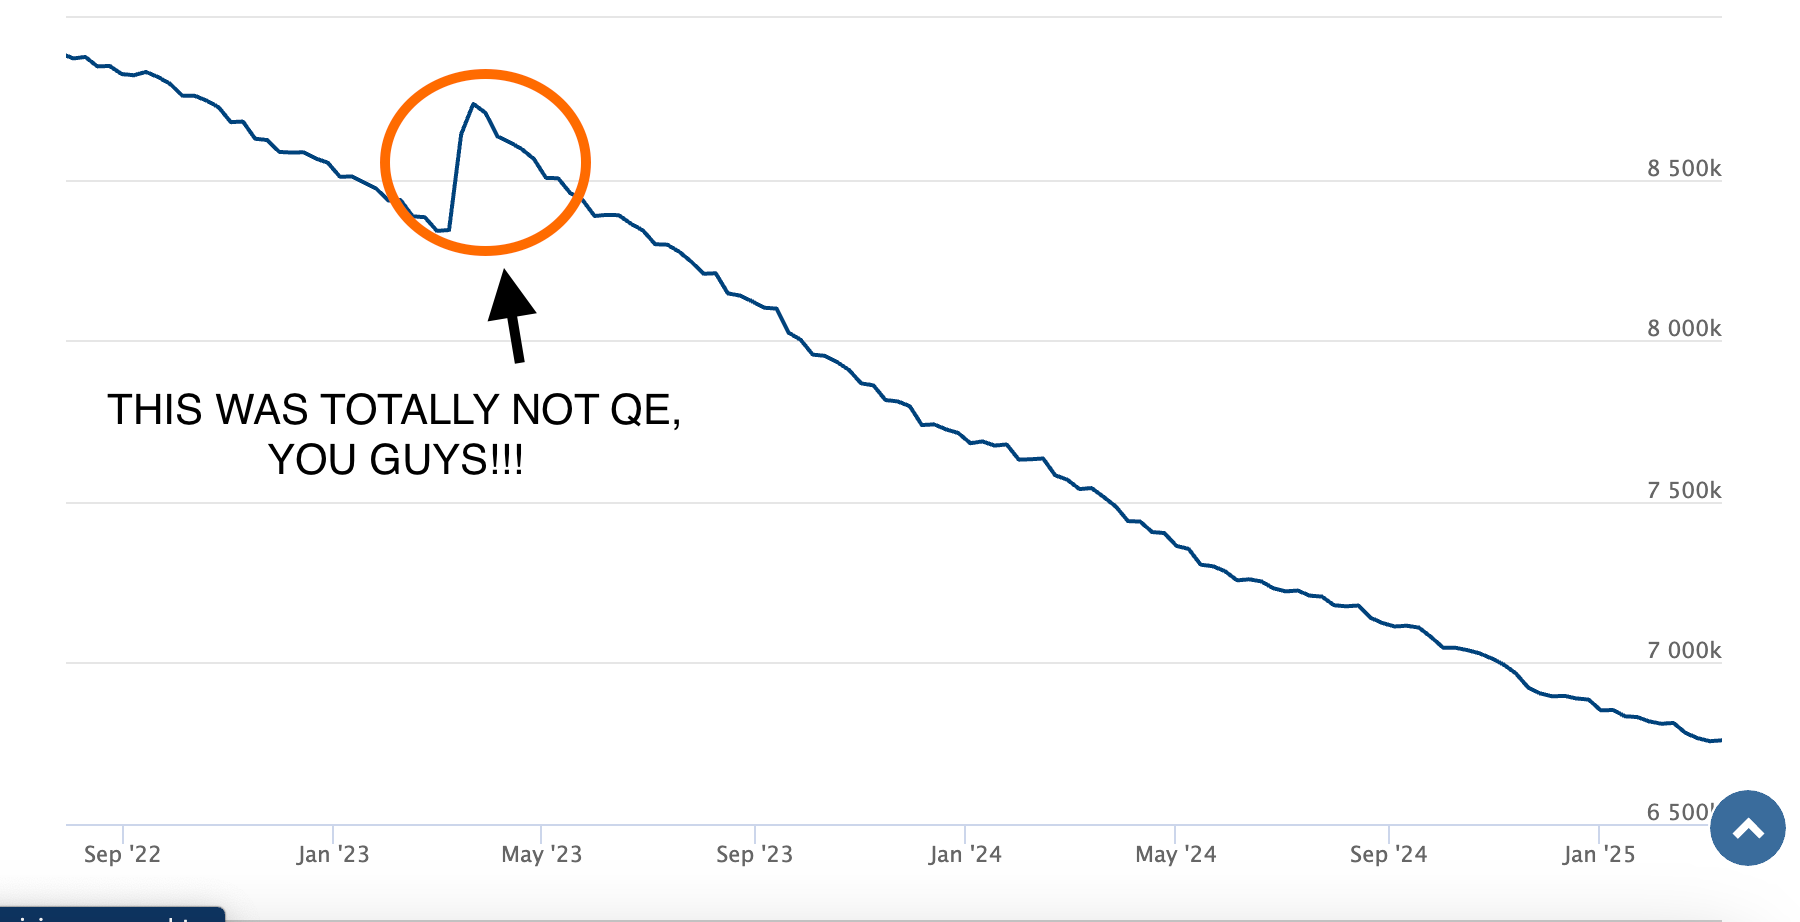
That’s where Michael Howell at CrossBorder Capital came in, analyzing stimulus efforts over the last few years.
Think back to the Howell Op-Ed in the Financial Times in December 2022.
Howell notes that since late 2022, the Federal Reserve has engaged in “quantitative support,” while the Treasury Department has flipped the script on the national debt.
This chart is from Michael Howell.

It’s how much money they pumped into the system over two cycles.
You know, 2020-21.
But you might not have visualized the sheer amount of “stimulus” we saw in late 2023 and all of 2024 (yeah, it was political).
Let’s only focus on late 23-all of 2024.

What Howell calls “non-QE-QE” are the Fed programs designed to create QE-like outcomes, but they are not called “QE” or “stimulus.”
The Fed started providing support after the GILT Crisis (change in policy on MBS). Then it opened up that bank lending program (even giving Japanese banks access to it) after the collapse of Silicon Valley Bank.
(Cough: It’s a form of stimulus!)
What Howell calls “Non-YCC-YCC” refers to efforts by a Treasury department to manage the yield curve.
They aim to lower the yield curve's lower end. (Inversion is a recession signal, right?).
In late 2022, Yellen started focusing on selling short-term bills (under one year duration).
And that decision on T-bills is what makes the whole story so problematic.
Why Treasury Bills?
T-bills are incredibly important because they are considered the prime asset to use as collateral in the Repo markets.
They function like cash, and more bills mean more cash-like assets in circulation.
These bills accelerate liquidity creation in the financial system (Capital Wars) and the shadow banking world.
They are extremely high-quality collateral—effectively rocket fuel—for the system. They allow companies like hedge funds to leverage positions and recycle capital multiple times quickly.
These bills act as extremely safe collateral in repo markets. Banks, hedge funds, and institutions borrow cash against T-bills, creating leverage.
The borrowed money flows back into risk assets like stocks, corporate bonds, and commodities, introducing new credit, leverage, and risk into the system.
The other thing about these bills is that they can be “rehypothecated.”
This means that borrowers can use them several times in repo transactions. Just like the Fractional Reserve System allows the same dollar to be amended several times, the same thing happens with T-bills.
The same T-bill can back multiple loans at the same time, which accelerates the system's liquidity. This liquidity is used in all sorts of transitions, like mergers, stock buybacks, and speculative trading.
T-bills are also used in the credit and securitization markets.
All those three-letter words you associate with the financial crisis come into play: T-bills structure and fund collateralized loan obligations, asset-backed securities, and mortgage-backed securities.
People structure these Wall Street creations like T-bills because they bring little risk and lots of liquidity. They also expand credit quickly, helping to fuel corporate buybacks, leveraged buyouts (LBOS), and debt-funded growth.
Now…
I hope you’re now screaming, “Garrett, what the hell are you talking about?”
Good, because this is exactly what I thought when I started studying all of this bullshit some 17 years ago.
It’s insane.
The leverage, the shadow banking, and the underbelly of the global financial system.
I haven’t even explained that T-bills are used in margin accounts to back trades like total return swaps, swaps, and options. Thus, T-bills help expand shadow bank leverage and boost speculative flows into stocks and bonds.
That’s why the stock market increases whenever the Fed or the Treasury Department accommodates the system. Credit, risk, and leverage expand.
So, as noble as Janet Yellen’s mission might be to help boost employment in the academic fishbowl, it leads to insane incentives on Wall Street.
And the use of T-bills only leads to an incredible amount of speculation.
How significant is it?
A massive portion of Treasury issuance done by Yellen starting in 2023 was in T-Bills.
This was short-term thinking. A “whatever it takes” attitude to keep the debt shell game going - and to avoid blame when and if the music stops.
This was trillions of dollars in liquidity, which increased Repo activity and credit, risk, and leverage.
As a result, Howell calculated roughly $5.7 trillion in secret stimulus” to the system last year.
Today, he puts that figure at just $1.5 trillion.
And if the markets need stimulus and the economy needs support, there’s a problem.
That’s a $4.2 trillion decline, or 14% of GDP.
As Michael Howell wrote last week, “And we wonder why the economy is slowing down?”
Which brings us to the punch line…
Fundamentals Don’t Drive the S&P 500
I want you to see in two charts what Yellen’s philosophies - which center around loose policies and a stock market that reacts to leverage and risk expansion.
That is the Chicago National Financial Conditions Index (NFCI).
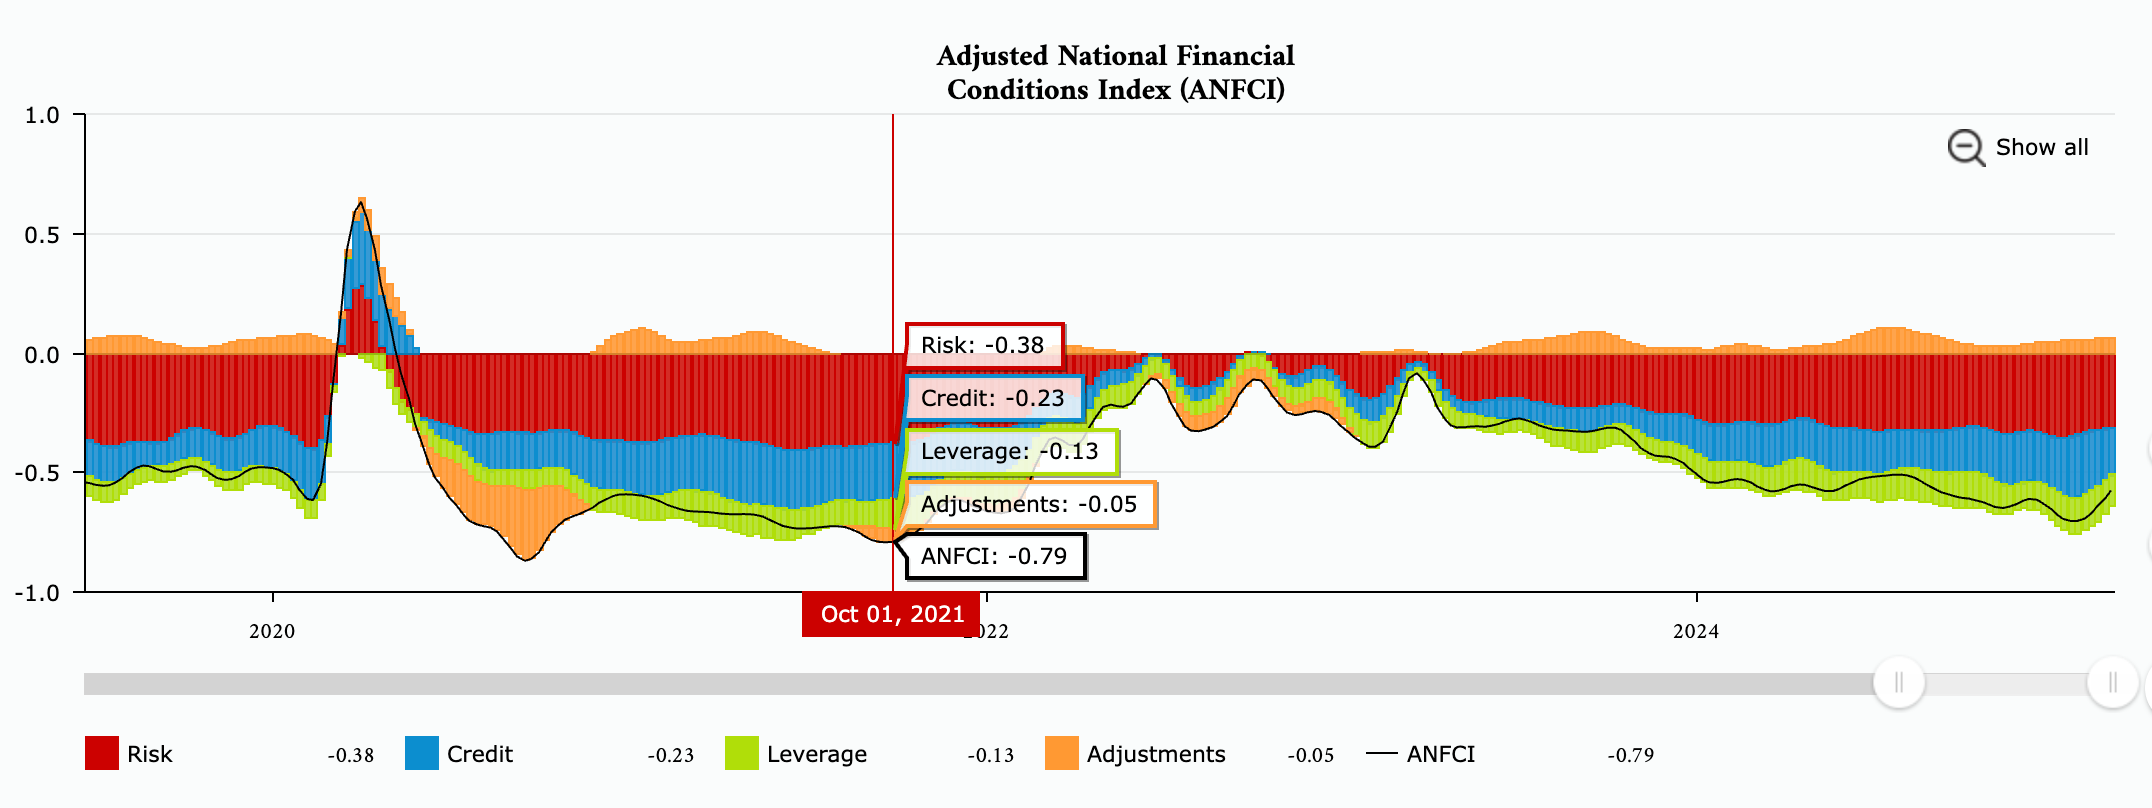
This index measures U.S. financial conditions across credit, risk, and leverage.
A positive value on the chart below signals tighter conditions. That was the case in March 2020, during a liquidity crisis. Meanwhile, negative values indicate looser conditions, with more risk, leverage, and credit in the system.
Again, as conditions expand, risk, credit, and leverage expand.
When conditions contract, risk, credit, and leverage leave the system.
Now, compare that to the S&P 500 over the last five years. When economic conditions since COVID have tighthened, the equity market has gone down…
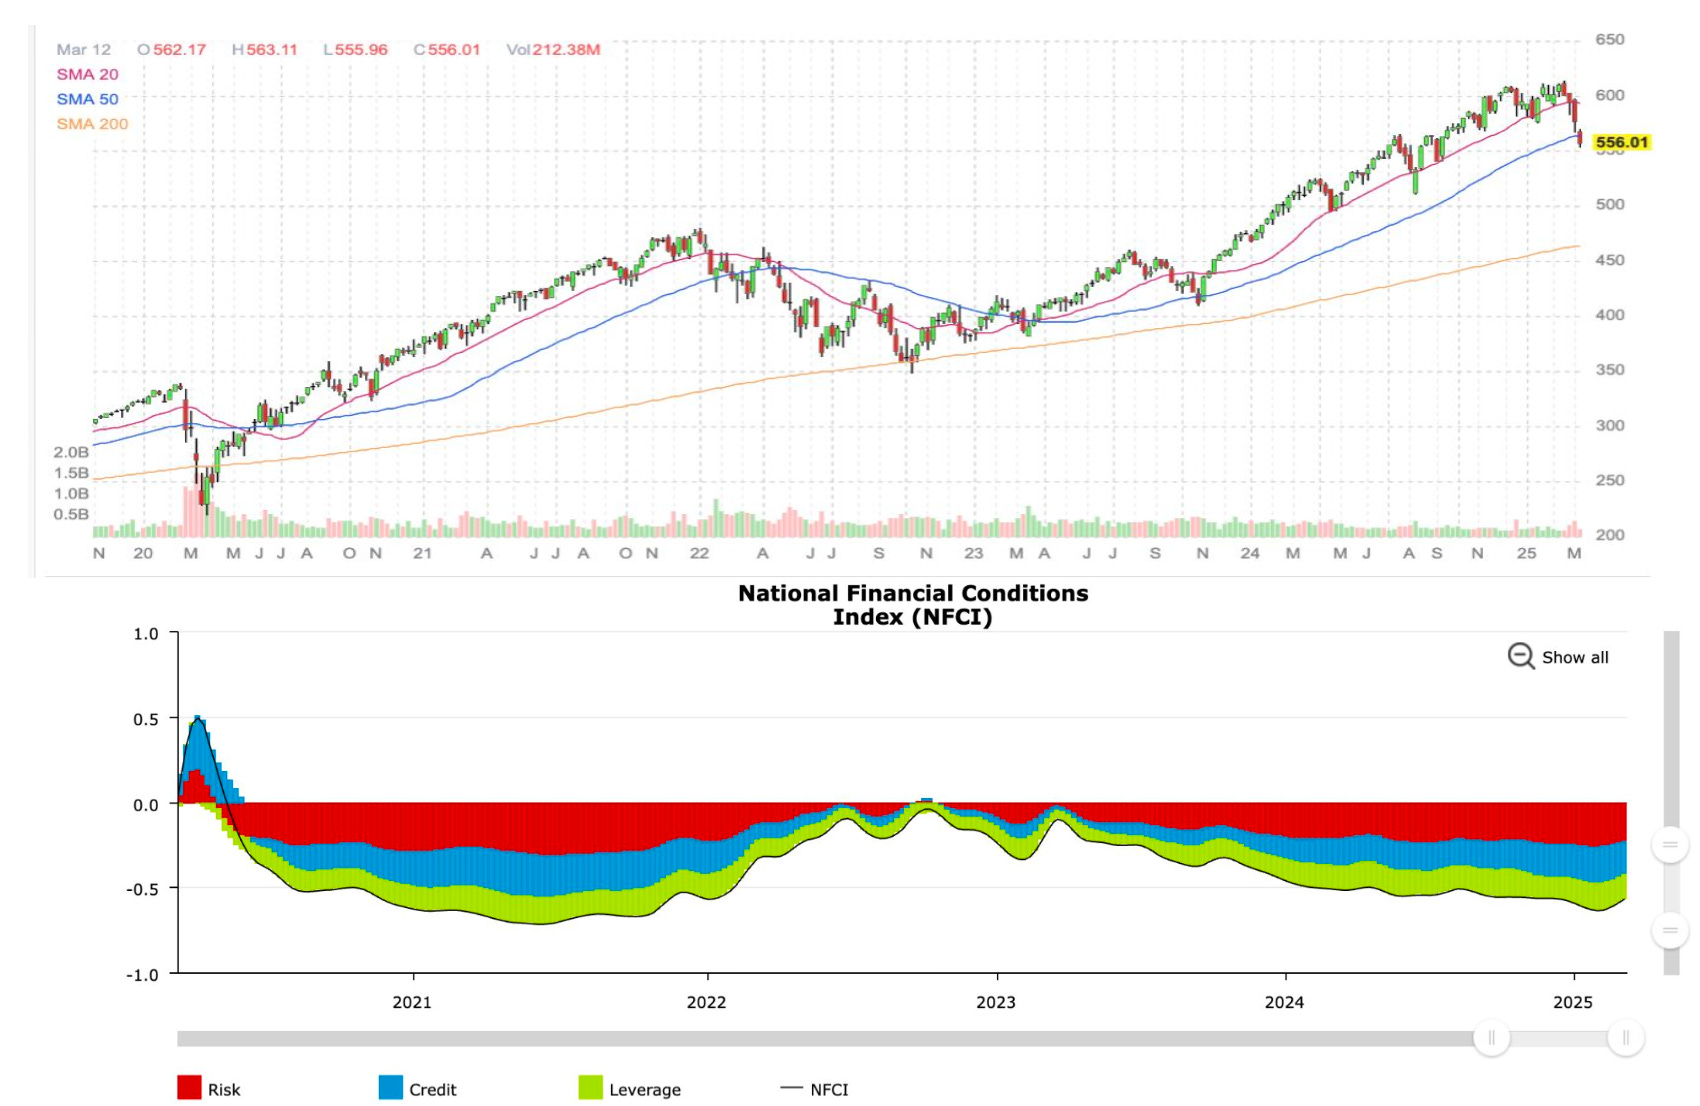
When the Fed and Treasury increased liquidity (as evidenced in 2022 and 2023, and then 2024), then risk, credit, and leverage increased…
Okay, you may not see it in that chart above.
How about I flip the NFCI upside down?
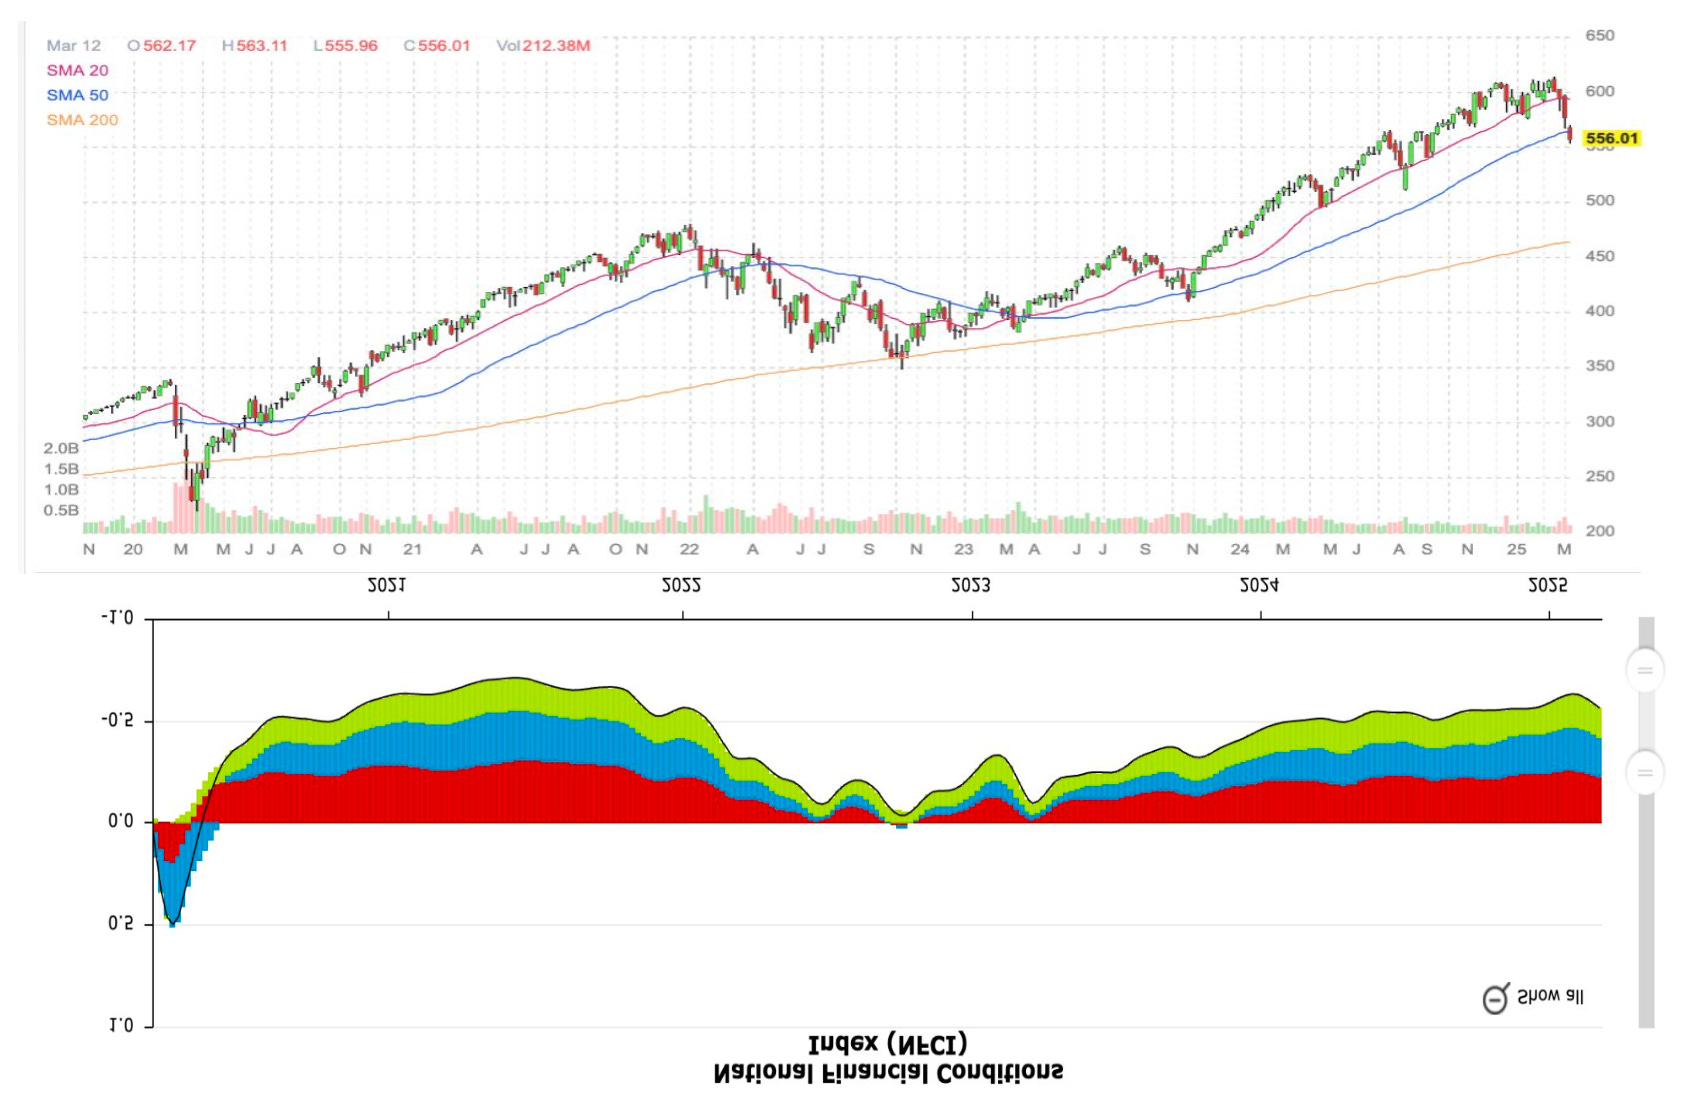
Look at the two charts in unison.
This is the story of the U.S. equity markets over the last five years.
It has relied so heavily on stimulus from the Fed and Treasury in various forms (there are so many forms that we had to create new program names for all of them).
Those two charts show what a financialized economy – one that doesn’t operate on actual fundamentals and doesn’t seem to make shit aside from Exchange Traded Funds, Collateralized Loan Obligations, and other nonsense – looks like.
Howell and Stanley Druckenmiller have both noted that liquidity and capital drive markets. And we had lots of it enter the system since… 2023.
What else do we need to understand here?
While liquidity is expanding globally, for now, we will hit a top in that cycle by the end of the year or sooner.
If we look at the chart above, Janet Yellen is the architect of this.
She has loved to print money since she first arrived on the scene in the 1990s.
She advocated for a 2% inflation target in the mid-1990s, which led to today’s massive economic inequality.
Since 1993, the purchasing power of the U.S. dollar has been down 55% - largely due to the policy she advocated.
She has never missed an opportunity to print… to pump… to “save the economy.”
All the while, her policies have fueled incredible levels of inequality, dislocated the markets from the real economy, and left behind an overinflated market due to massive stimulus runs through our Treasury system.
Oh… and trillions and trillions in debt.
Ultimately, the Fed will have to monetize again – by the front end of the curve- and drive the bubble up again.
For now, we’re watching a balloon lose air.
I have long argued that there is no such thing as a Bull or Bear market anymore.
There are liquid markets and illiquid markets. There are VERY LIQUID MARKETS (like Q3 2020 and Q3 2024) and VERY ILLIQUID ONES (late 2022)… This isn’t about being bullish or bearish. It’s just a matter of putting all the pieces together.
Janet Yellen was the champion of liquidity at any cost, and investors and speculators did very well. But the rest of us - we’ll be left holding the bag.
Isn’t economics great?
What a hell of a thing to dedicate your life to…
I need a drink.
Stay positive,
Garrett Baldwin
Secretary of Long Rants
Bessent...Today
"What I could guarantee is we would have had a financial crisis. I've studied it, I've taught it, and if we had kept up at these spending levels that -- everything was unsustainable," Bessent said on NBC's "Meet the Press." "We are resetting, and we are putting things on a sustainable path."
Incredibly well said.