
Happy Mother's Chart Party...
Thanks for everything, mom. My gift to you is a few charts that I'll try to explain later.


Dear Fellow Traveler:
When I first started my graduate thesis at Johns Hopkins in 2012, I approached it with a specific goal. I wasn’t trying to get published or build a following for my views on the 2008 crisis and its impact on corporate leadership and institutions.
I wanted to be able to explain to my mother… in one sentence… what a derivative is.
I managed to get it down to two sentences by the time I graduated…
Now, in one sentence, I simply state: “A derivative is a financial asset whose value is determined by the price of a separate asset.”
Honestly… I have enough of a sense of humor to admit that this sentence tells us nothing and invites a lot more questions.
But those aren’t questions that we need to answer today at our chart party.
We need to know why the U.S. is selling gold to China…
Why the SpaceX IPO feels like a massive extraction of wealth
Why the bubble economics of this AI rally are historic…
Why money in the money market ISN’T money sitting on the sideline…
And why Berkshire remains the best contrarian buy right now…
Let’s chart party…
Chart 1: The U.S. Is Selling Gold… Lots of It…
The largest export for the U.S. in 2026?
It’s gold… And it’s not even close.
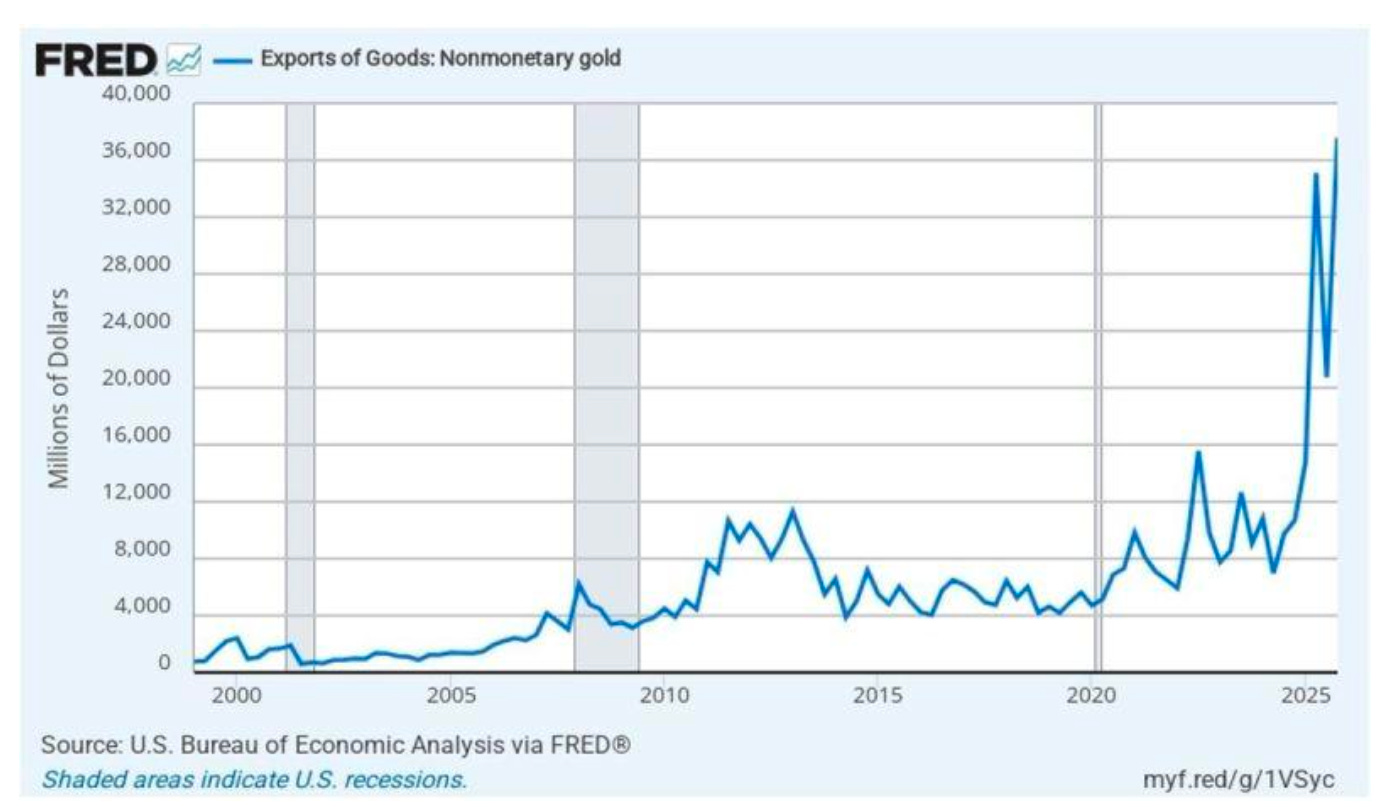
In February, the U.S. exported $29.4 billion in precious metals.
Gold exports were 1.7 times larger than oil, roughly double pharmaceuticals, and about 2.5 times larger than aircraft engines.
Precious metals went from approximately 4% of total exports to 12.7% in the first two months of 2026.
In January, Forbes called it “unprecedented” that gold had been the top export for two whole months and predicted it would fade.
That was four months ago… and it’s only taken off…
Gold is leaving U.S. vaults… and flying to Switzerland.
There, refiners melt down 400-ounce COMEX bars and recast them into one-kilogram bars… the format China prefers… and then it goes to China.
Swiss gold exports to China rose 18% in March alone.
Let’s put this into plain English…
The world’s reserve currency country is shipping the oldest money in human history to its biggest geopolitical rival, running it through a Swiss layover like a connecting flight from “everything is fine” to “oh no.”
Meanwhile, Commerce Secretary Howard Lutnick went before the Senate to brag that the administration had “dramatically increased exports to over $3.4 trillion.”
America is melting down monetary insurance and shipping it overseas while politicians celebrate the trade numbers like a family selling copper pipes out of the walls to make the mortgage payment.
Why is Gold Leaving
The initial trigger was a tariff-fear arbitrage that pulled 25 million ounces into COMEX warehouses from late 2024 through March 2025, the largest quarterly inflow in exchange history.
When the White House exempted precious metals from tariffs on April 3, that trade died, and the gold needed to go somewhere.
The trade didn’t return to London…
It moved through a different tunnel.
Foreign central banks are withdrawing their gold from American custody.
The Banque de France replaced 129 tonnes of gold formerly held at the New York Fed with compliant bullion now held in Paris… officially a reserve “upgrade…”
That term ranks somewhere between “transitory inflation” and “weapons of mass destruction” on the historical leaderboard of phrases that should make you want to secure your wallet.
German lawmakers have gone on the record saying U.S. vaults are “no longer safe.”
Okay then…
In 2024, 41% of central banks stored gold domestically.
In 2025, that jumped to 59%… an 18-point swing in a single year in a world that usually measures these shifts in geologic time.
These are the most boring, most conservative, most “let’s form a committee to discuss forming a committee” institutions on earth.
They don’t panic buy or chase momentum.
They are buying gold at nearly triple their historical rate… 1,237 tonnes in 2025 versus a 473-tonne average from 2010 to 2021… while removing it from American custody.
If your financial advisor started moving his own money out of the fund he was telling you to buy, you’d ask questions.
Someone… ask questions…
Chart 2: The SpaceX Grift Cometh…
Instead of building infrastructure, our best and brightest are building MORE ETFs…
Nine space-focused ETFs have launched or filed since September 2025, with six filing in 2026 alone.
There are UFOD, MARS, SPCI, NASA, SPCL, ORBX... all born in the last three months.
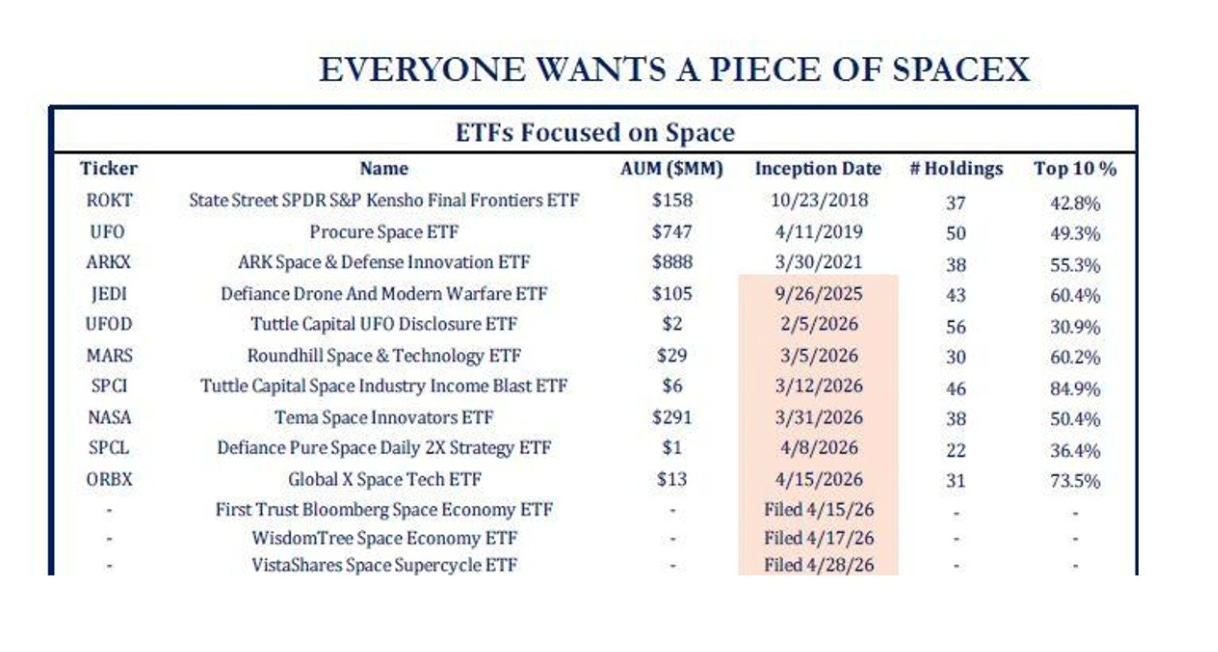
Three more filed in April.
As I wrote in “The SpaceX IPO is What’s Broken with the Market,” the passive plumbing is being pre-wired before the stock even trades.
Only a 5% float will force mechanical buying, artificially inflate the founder's wealth, and force everyone into the stock, whether they want it at its 100x revenue valuation or not.
One ETF changed its methodology specifically, so SpaceX qualifies on day one.
I am on the record. I think the whole thing stinks.
Here’s today’s video on the subject…
If the only answer to this IPO is… “Yeah, but everyone is going to make money…” then we have lost the plot.
Those are famous last words… I refuse to pretend this is real capitalism.
I’ll defend this hill, mourning something that was beautiful and eroding, while others ignore me and cash out screaming, “Well, everyone else was doing it… What’s the problem?”
The problem is right in front of us… Look at it.
This isn’t how public markets are supposed to work.
Chart 3: Money Market Funds at $8.19 Trillion
There is now $8.19 trillion in money market funds, the highest level in history, and the chart has gone essentially vertical since 2017...
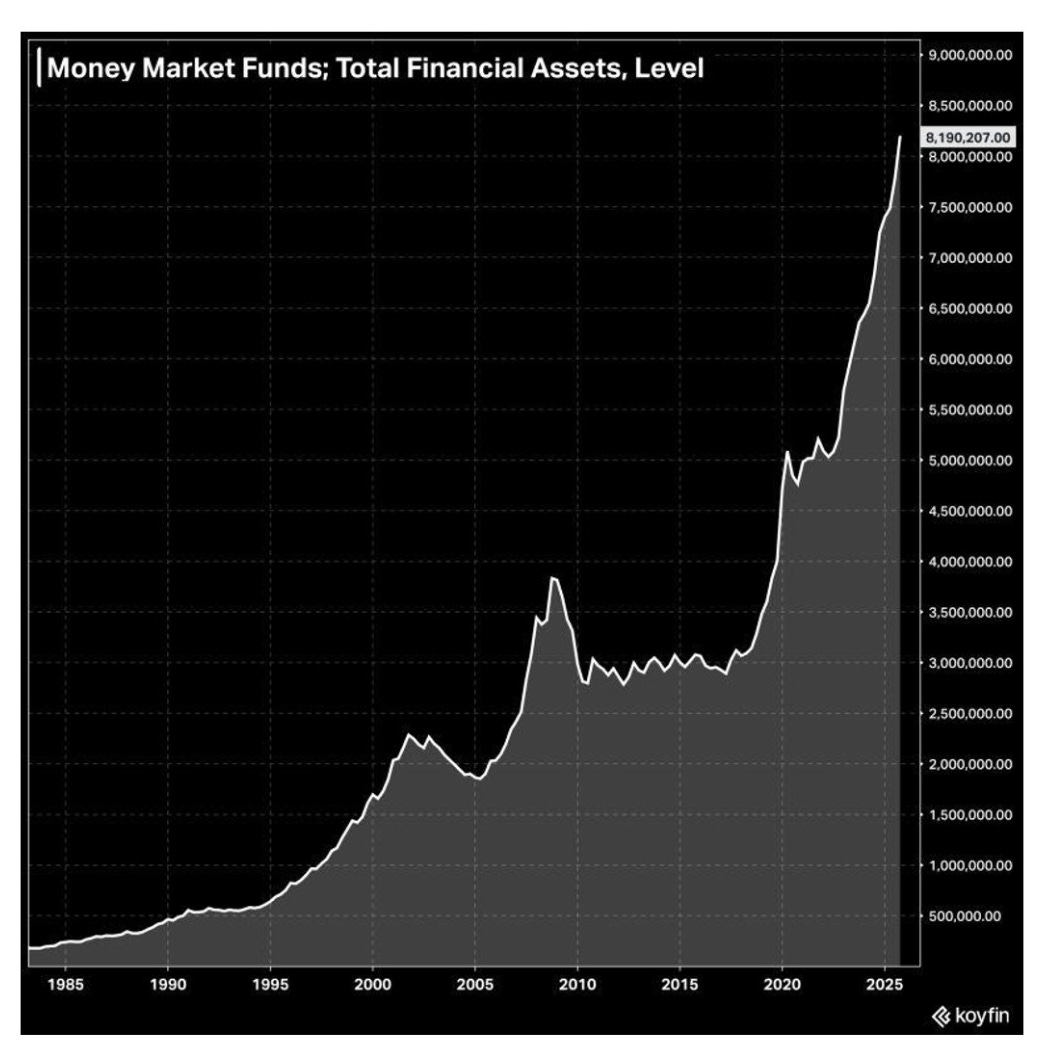
Some people say that this money is "cash on the sidelines," which is misleading.
This is not money waiting to deploy.
This is money that is already deployed... as collateral.
Money market funds hold T-bills and repo, which serve as the base layer of the leverage stack.
Every dollar in this chart is being rehypothecated, posted as margin, used to support carry trades, and multiplied through the collateral channel.
As we wrote in "How The Treasury Replaced the Fed," bill issuance is expanding this base directly... and Treasury buybacks are suppressing the MOVE index to keep the entire structure intact, as highlighted by Howell in recent months.
This chart doesn't show dry powder.
It shows the foundation of the leverage pyramid.
When it grows, leverage grows.
When it contracts, everything built on top of it contracts at the same speed in the same direction.
It also shows where the momentum concentration lives… The cap weight on our screen at 233 indicates that only a small number of stocks are doing all the lifting in this market… This is our current reading on MoneyPrinterPro.com right now…
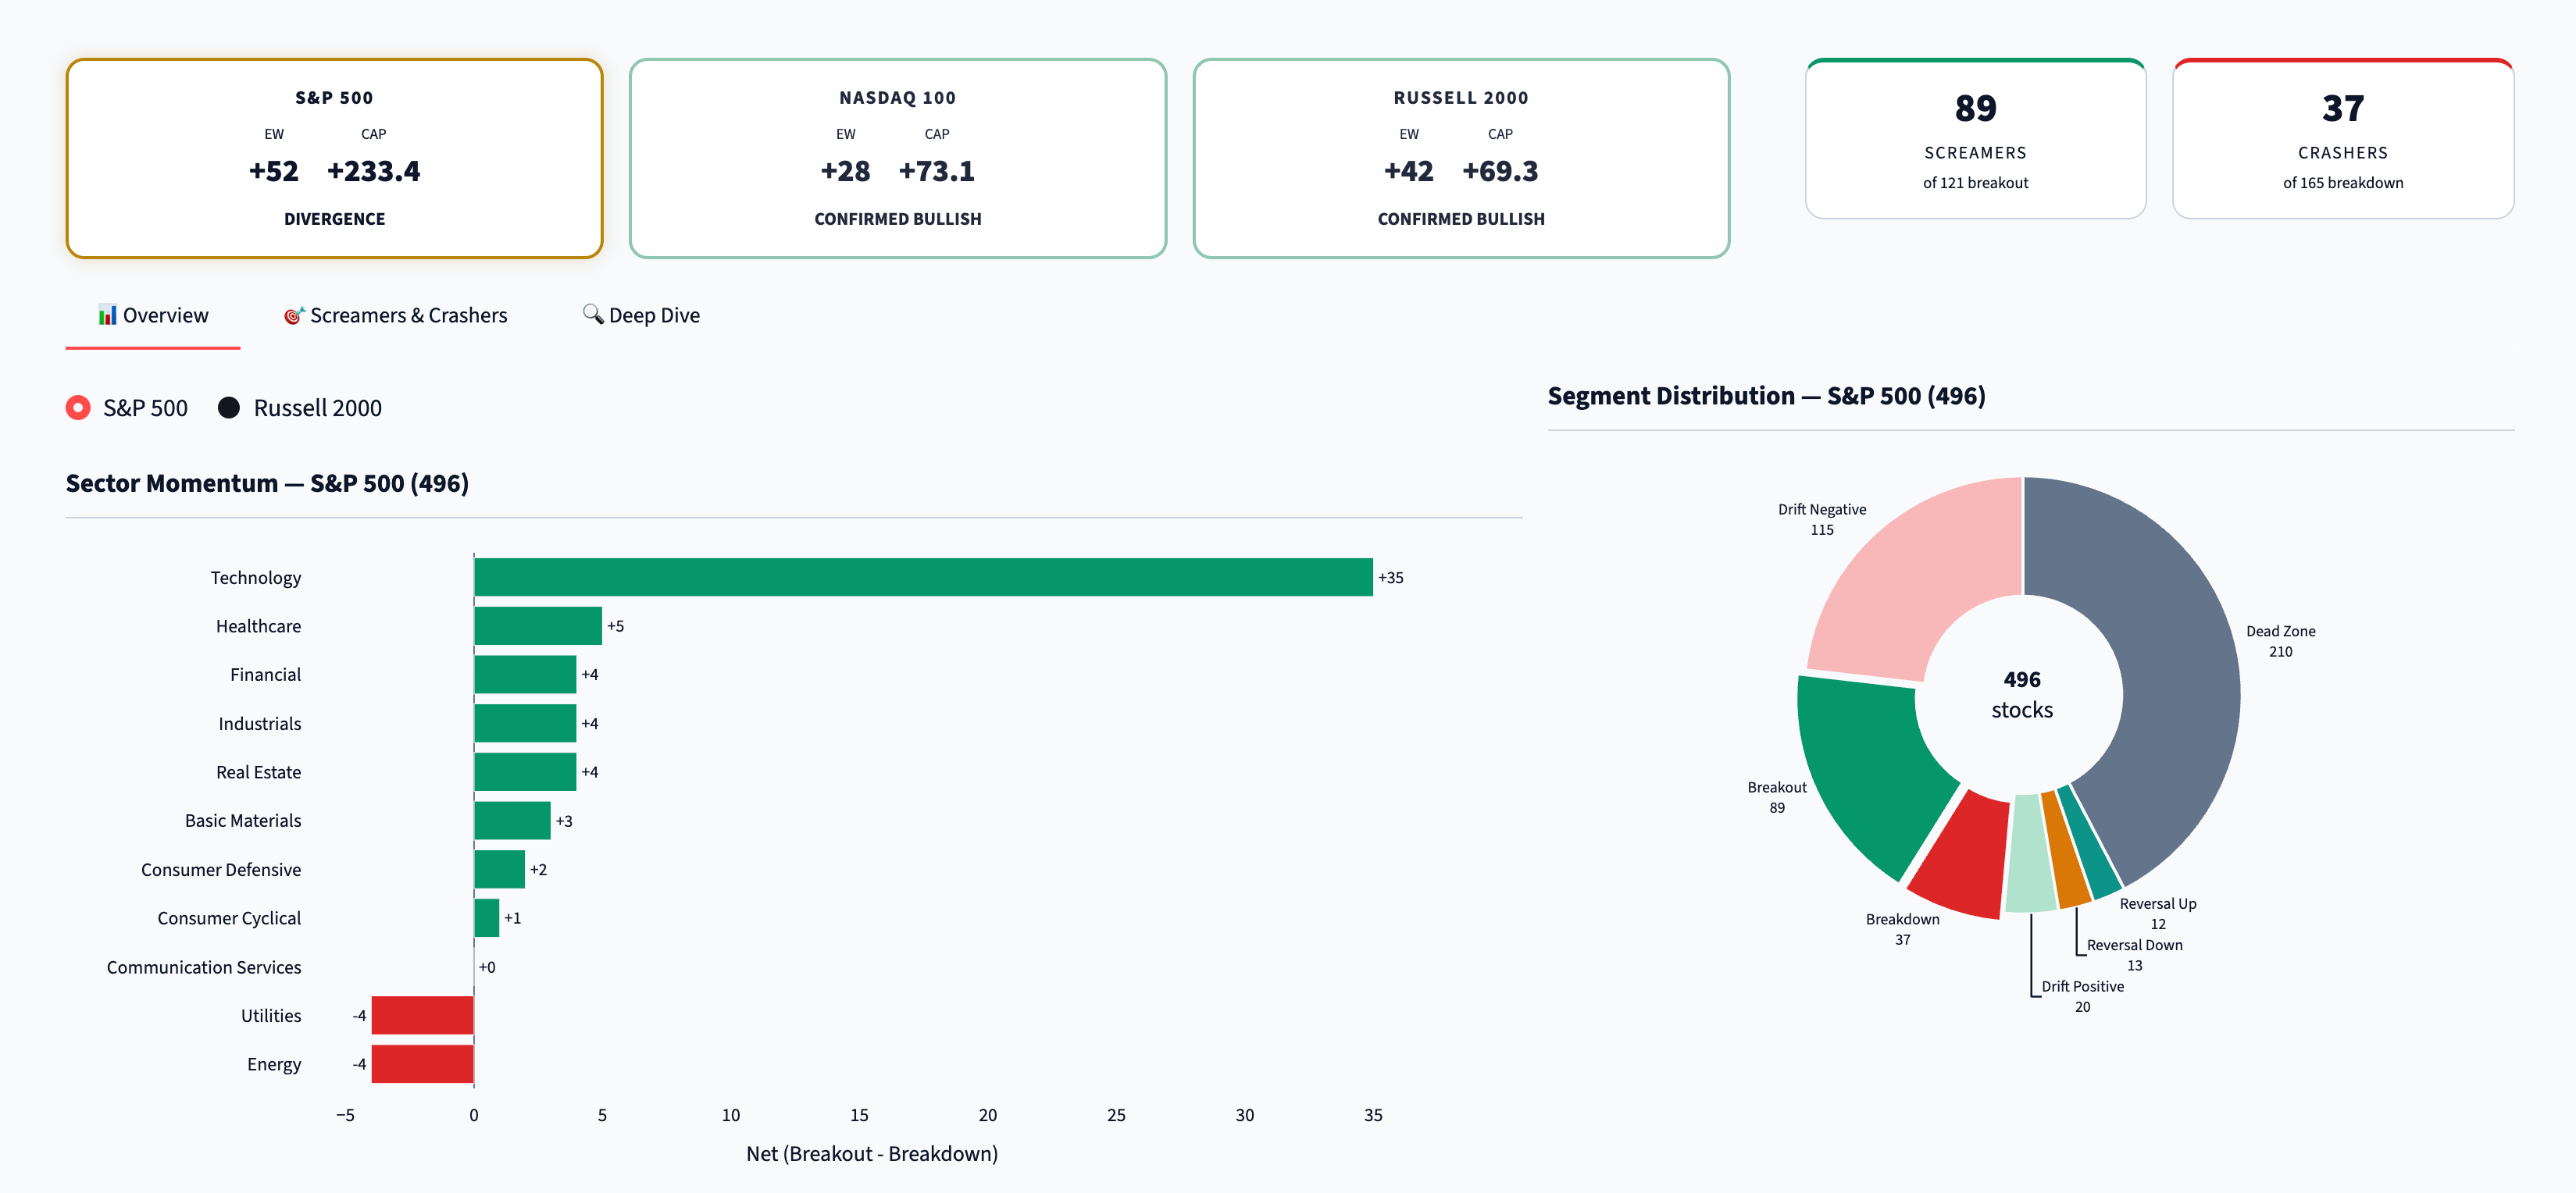
Check it out…
Chart 4: Berkshire Underperformance (I’m Long)
Berkshire underperformed the S&P 500 by roughly 40 percentage points in the year following the 2025 annual meeting, the worst relative performance since 1999.
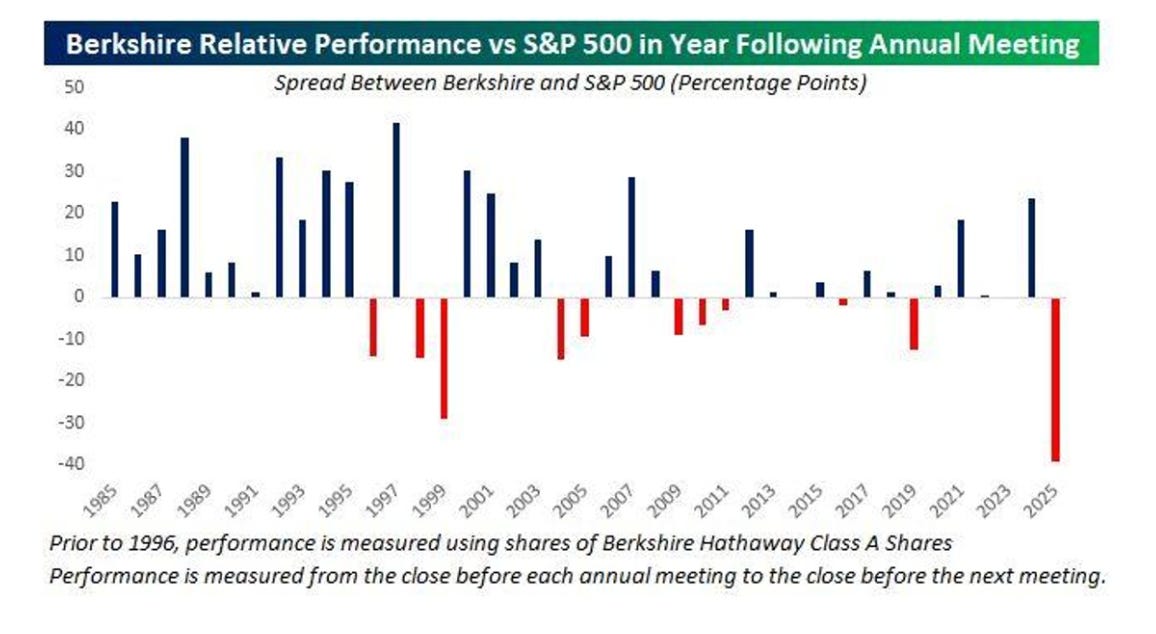
The last time Berkshire lagged this badly, Buffett was being called a dinosaur who didn’t understand the internet, and then the Nasdaq fell 78%.
The company is sitting on over $300 billion in cash and short-term Treasuries.
They’re not underperforming because he lost his touch.
They are underperforming because Berkshire refuses to play in this insane sandbox…
The last two times they did this, the people playing wished they hadn’t been.
Keep an eye on the door… and consider STEW as a buy if and when this market starts to crack.
Chart 5: Concentration in Historic Bubbles — 40% Again
The liquidity injections since last October now sit at roughly $600 billion, according to CrossBorder Capital. That explains where we are… why momentum has remained resilient… and why the 1% pattern matters more than ever…
It also explains the momentum concentration… as investors don’t seem to trust anything other than this AI trade… at a time when the cycles should be peaking…
The AI Big 10 now represents approximately 40% of the S&P 500, which is the same concentration level reached by the Nifty Fifty in the early 1970s, by Japanese equities in the late 1980s, and by tech and telecom in 2000.
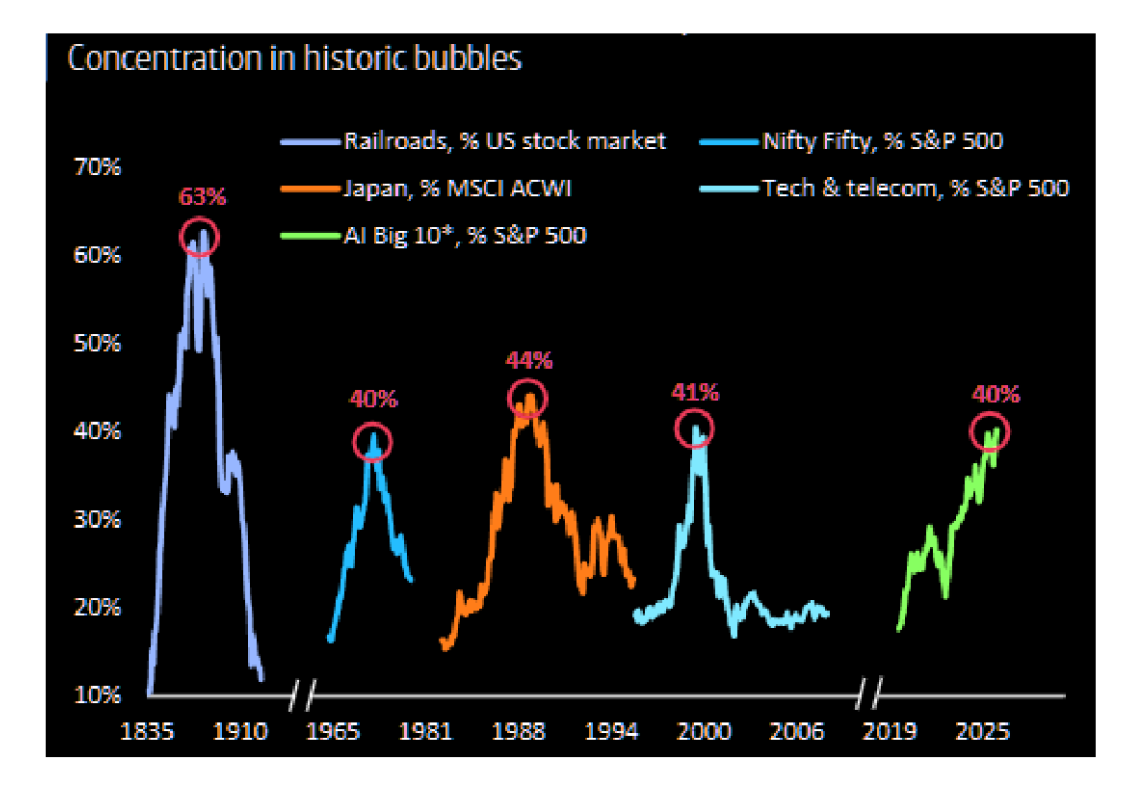
Every single previous instance at this level ended the same way...
It ended with a multi-year drawdown that wiped out the concentration and punished everyone who assumed this time was different. It has looked several times like we were at the start… but then Treasury and the Fed continue to pump money into the system… over and over again…
The passive flows are just insane…
Adam Taggart notes the distortion…
We aren’t operating in a market.
We’re witnessing a funnel.
And funnels work in both directions.
Play the game until it breaks… and keep an eye on our momentum signals (the last time it went positive was… April 7)…
When this breaks, we’ll know in real time...
Happy Mother’s Day to all mothers. I’m taking my wife and my daughter to brunch now, and then she gets peace and quiet for the day…
Which means I am going to see the Super Mario Galaxy Movie…

Pray for me… I have a feeling that I’m going to get motion sickness from this…
Stay positive,
Garrett Baldwin
The STEW suggestion is interesting, considering it has the ability to trade at such a steep discount to NAV. Normally that would be arbitraged away. It would be frustrating to hold something that doesn’t match underlying holdings in the near term
Thanks Garrett. I’m sending your article on the Space X IPO to all my elected officials. You are right. This is not capitalism.