


How We Confirm Sector Momentum (The State of the Market)
A few little secrets for anyone who wants to understand market momentum.

Dear Reader:
A few days ago, I was reading an article about the 1987 market crash. The question was whether it was possible to have predicted that sharp collapse.
The author (the article was written in March 2020) noted that there were stark similarities between the crash of 1987 and the COVID collapse. To understand what went wrong, pay close attention to the Red and Green lines. They are, respectively, the 20-day and 50-day Exponential Moving Averages (EXPMA) of the S&P 500. As I’ve said before, NOTHING good happens under the 20- and 50-day moving averages for the S&P 500 (for the broader market).
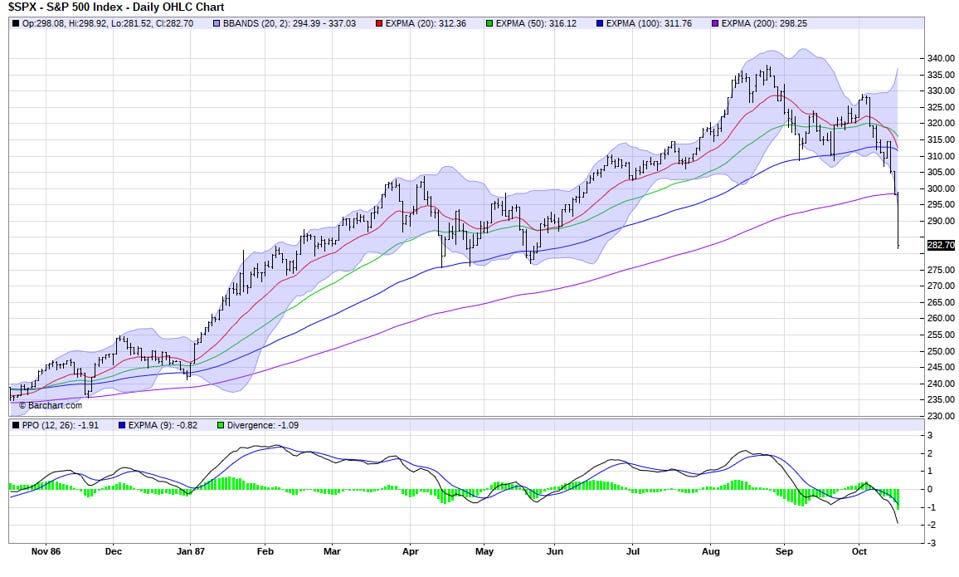
The chart above was the 1987 crash.
And for reference…
Now, the obvious question is the difference between the Simple Moving Average (SMA) and Exponential Moving Average (EMA).
A simple moving average averages all prices equally. An exponential moving average gives more weight to recent prices, so it reacts faster to new market moves. The EMA will catch bigger moves maybe 24 hours sooner th…
Keep reading with a 7-day free trial
Subscribe to Me and the Money Printer to keep reading this post and get 7 days of free access to the full post archives.