
Nothing Like a Chart Party...
Phase 1: Collect Charts. Phase 2: ? Phase 3: Profit


Dear Fellow Traveler:
There’s a great scene in South Park’s early years… It’s an episode where the so-called Underpants Gnomes keep breaking into a kid’s house and start stealing his underwear.
The episode satirizes the ongoing complaint that big businesses are soulless and drive smaller, independent companies into bankruptcy. There are many who also view this as a critique of socialism… in the gnomes business model.
The business model is broken down in three steps.
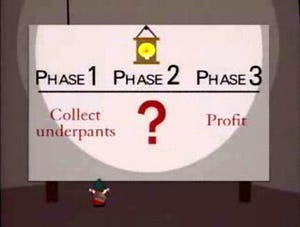
Phase 1: Collect Underpants.
Phase 2: ?
Phase 3: Profit
When characters ask the gnomes what Phase Two is… which again is just a question mark, the gnomes ask each other, and then skip ahead to one of them simply screaming… “Phase Three is Profit!”
I have always enjoyed this joke for a wide range of economic reasons, and this is as close to a punchline as you can get when it comes to how the world really works and how central planners think.
Step One: Seize the Means of Production
Step Two: ?
Step Three: Workers’ Paradise…
That said… I think I have finally found the answer to the Underpants Gnomes issues…
They should just take the Private Credit approach…
Phase 1: Collect Underpants
Phase 2: Package the future licensing revenue on the recycled underpants into a rated receivables facility, sell the senior tranche to a life insurance general account reaching for yield, and unload the mezzanine on a state pension fund that needs to show its board a better funded ratio. The prospectus will show that the gnomes get a modest origination fee, the sponsor collects 2 and 20, the rating agency will collect a services contract, and the equity mark will go up 11% this quarter because the sponsor says it did.
Phase 3: Profit.
Chart No. 1: Foreign Investors Like America…
As I’ve said time and time again… America remains the best game in town… and so much of this is price agnostic. As the Bank for International Settlements noted in their Annual Economic Report, passive flows have increased from 19% of the U.S. equity system in 2010… to over half in 2025… So… that’s something…
But now a few other things… look at how strong global fund flows have gone into U.S. equities. I want to point something out…
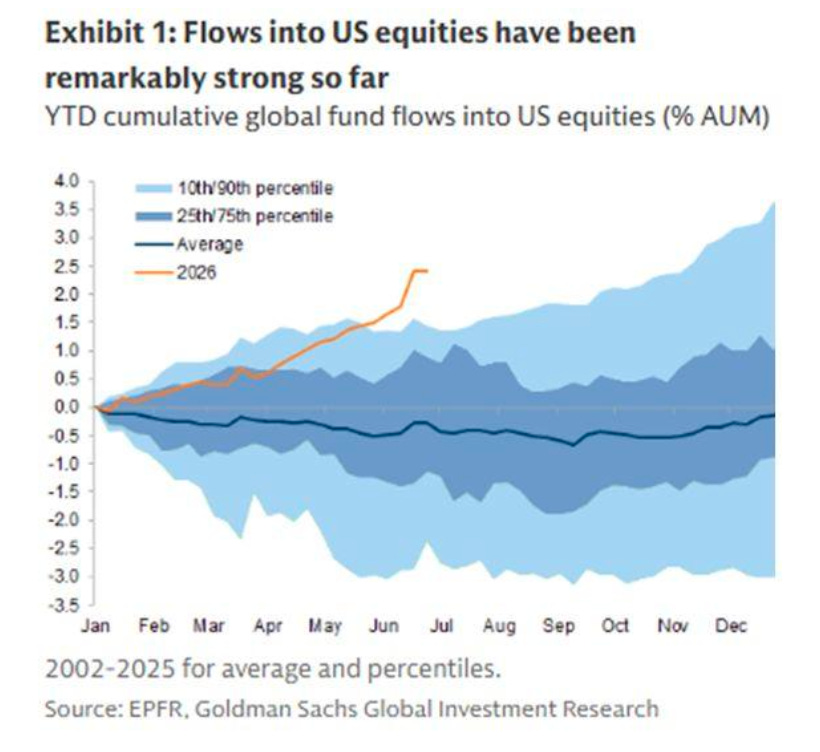
This take would require a lot more data right now… and I need to cite the right academics on the subject. And I will find it this week. But there is a paradox in the world of financial markets. We see robust inflows into U.S. equities when the Federal Reserve is doing Quantitative Easing. It’s been studied for a while, and it has shown that when the Fed “prints” money, foreign money comes here and chases alpha.
But Garrett… you scream… the Fed isn’t doing QE.
Right. Except they have been doing QE-like in the Reserve Management efforts, and we’re increasing the Fed’s balance sheet. I don’t care what the hell they call it, because the outcome is QE-like… and the intentions are the same as QE.
They have stabilized the banking system with this Treasury purchasing since December, and they eliminated the cap on the repo activity. This is central planning at its core… and these activities become a magnet for foreign capital.
I’m telling you right now… if China got around to debasing their currency tomorrow and announced a $1 trillion stimulus program that mimicked QE, I’d be renting other peoples’ hands so that I could buy Alibaba (BABA).
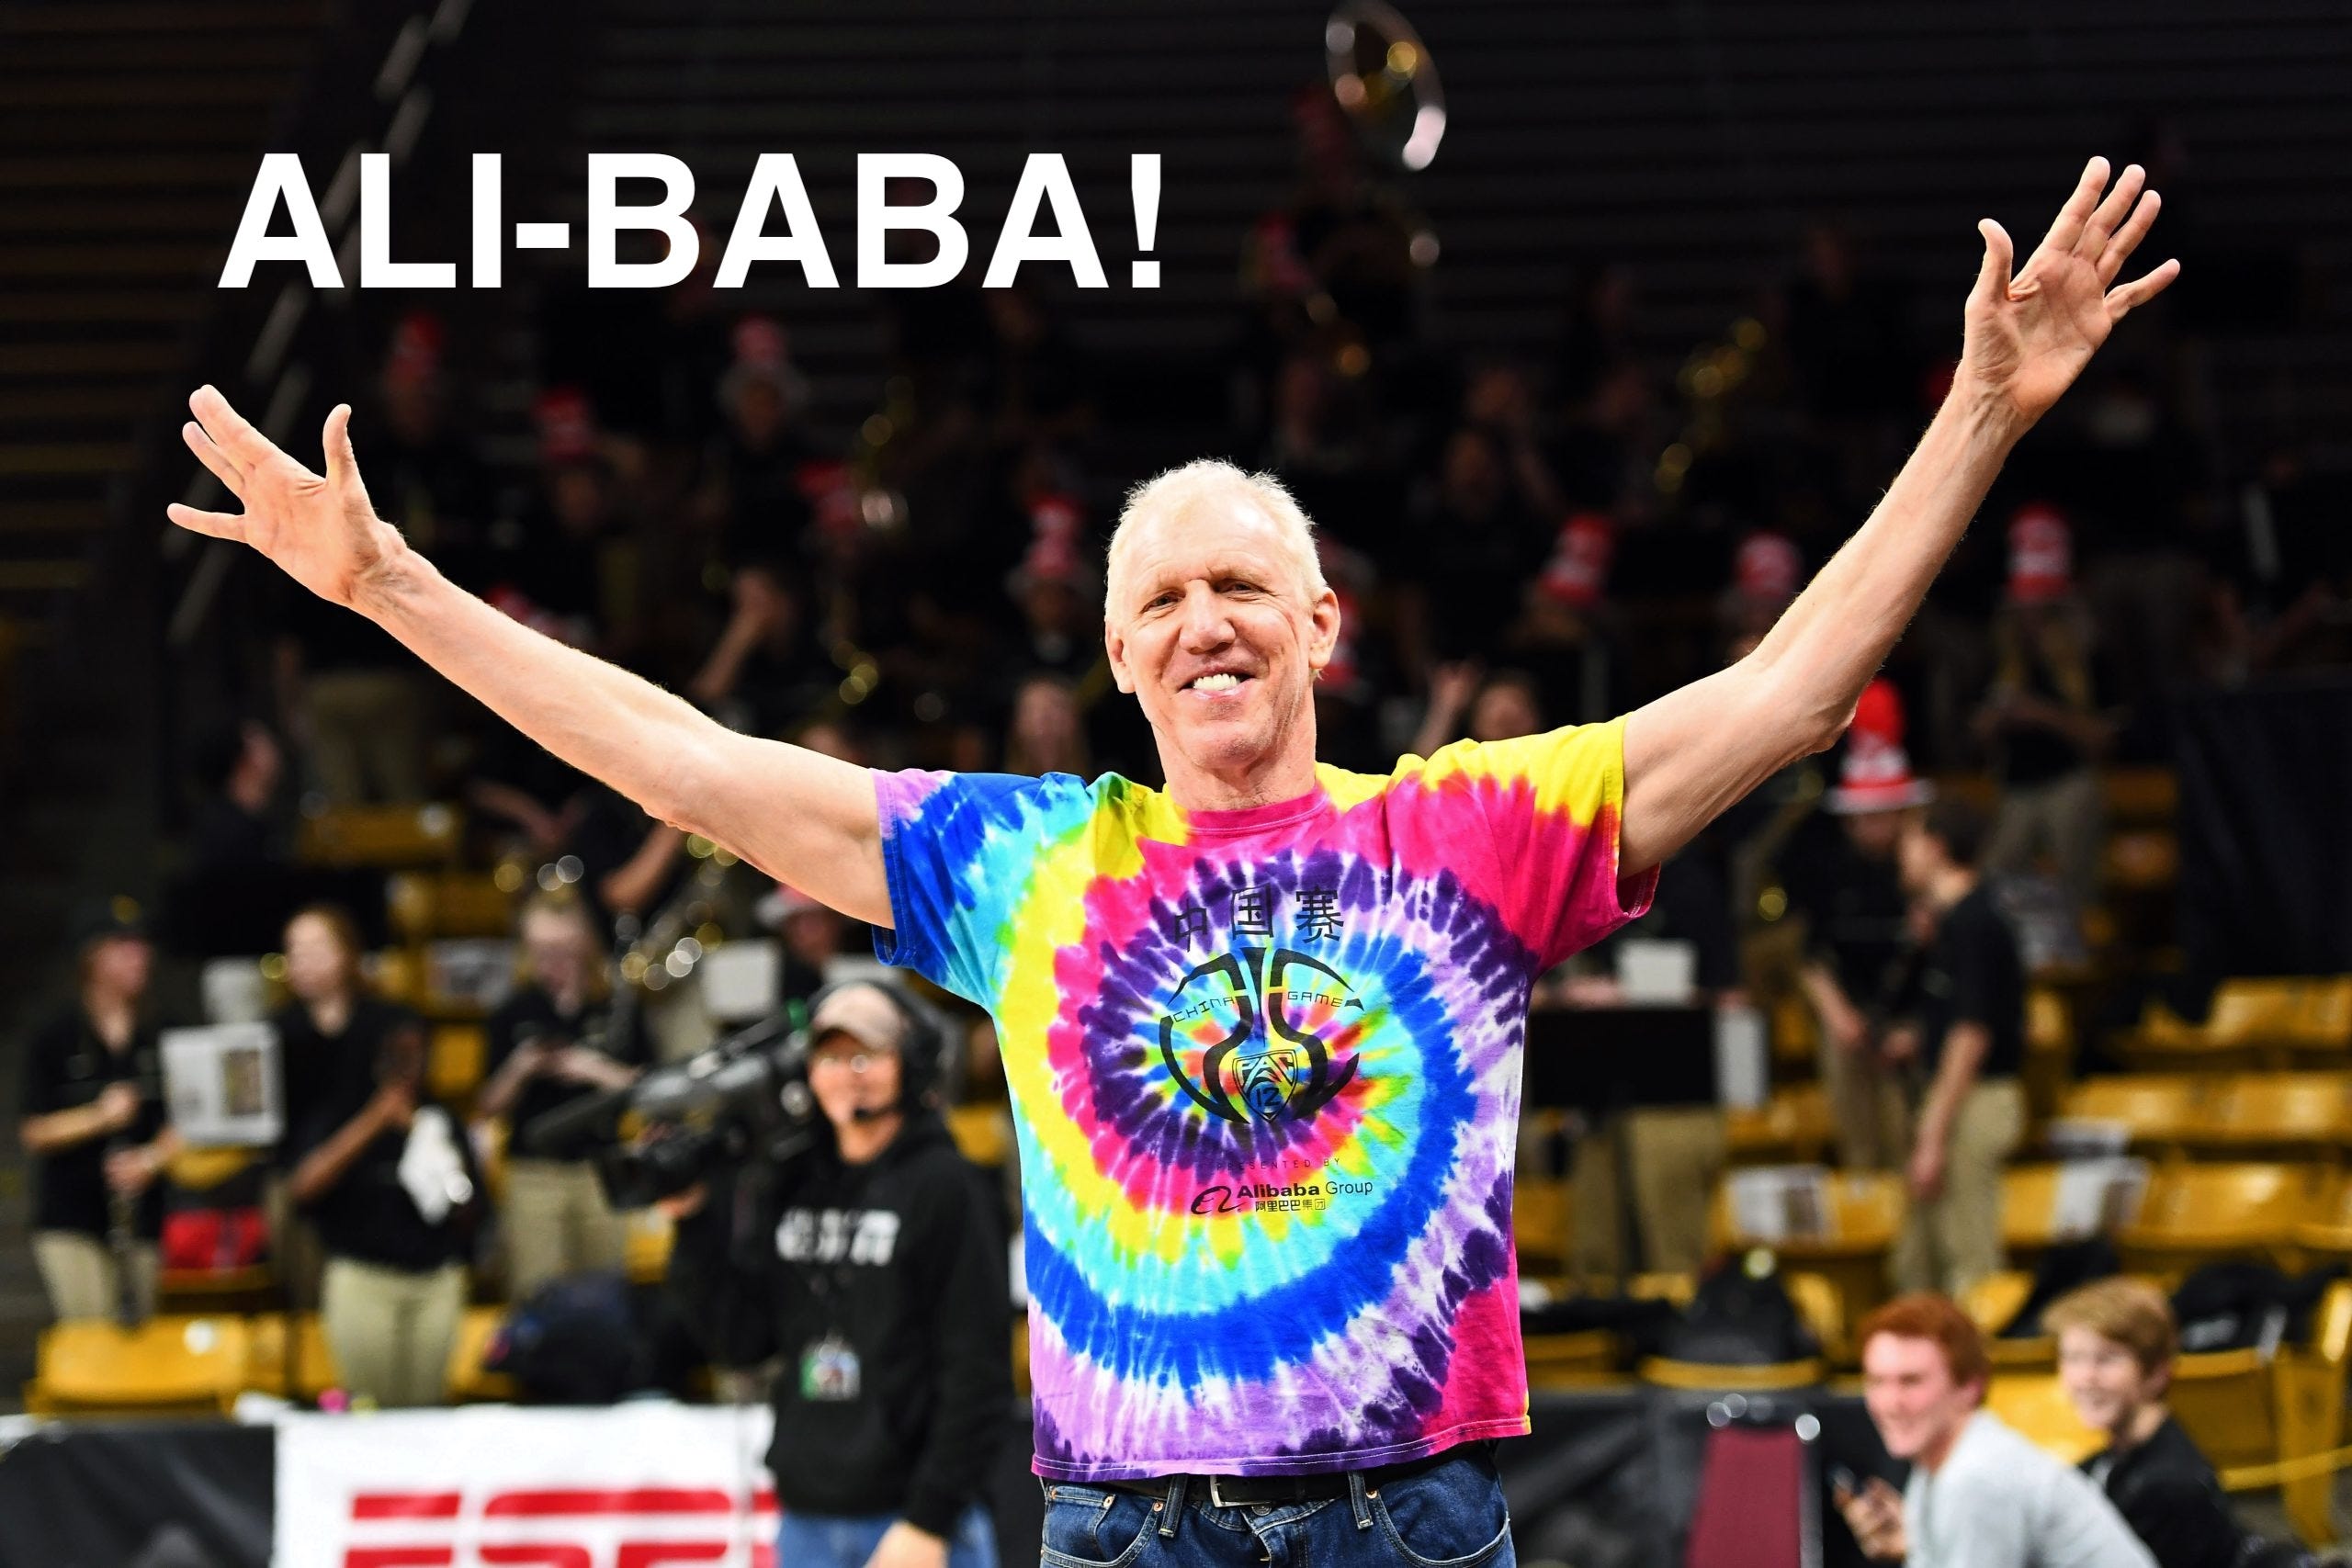
Chart No. 2: Same as It Ever Was
Zero-date options are another area of the market that are distorting everything. People have tried to claim that it’s not a big deal… but they’re either in on it… or they don’t actually understand how dealers have to hedge these positions.
This has been a major contribution to market support… and as you can see, it’s exploded since 2022. I’ve talked about the role of single stock leveraged ETFs. This is the other side of it…
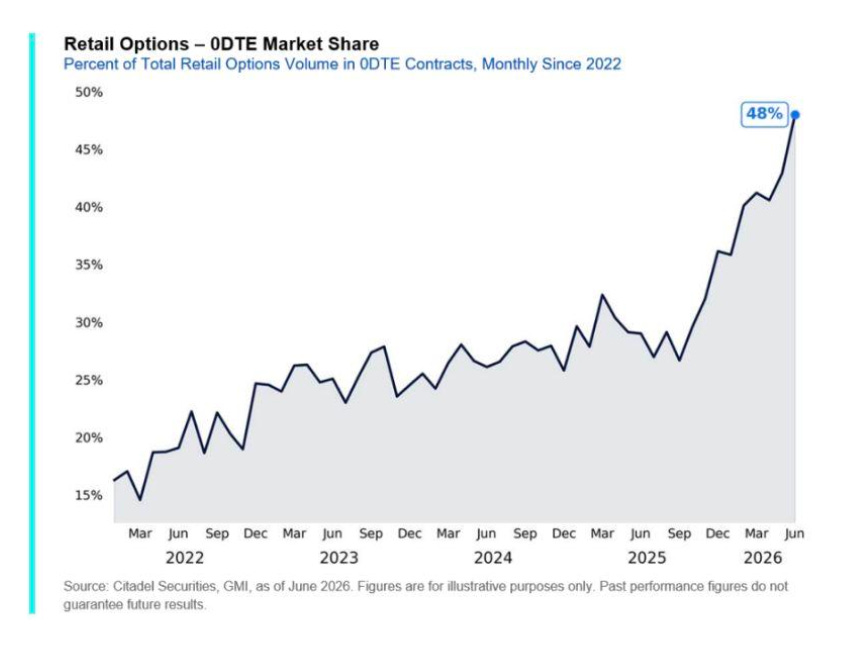
If someone buys a ton of calls on a Friday afternoon to the upside… the dealer has to hedge that position… And if you do that over and over… it’s clearly not anything linked to fundamentals. This is a casino…
So… what do you do? You learn to trade Volume Weighted Average Price. I’m going to do a video on Tuesday for my Money Printer Pro readers that lays all of this out…
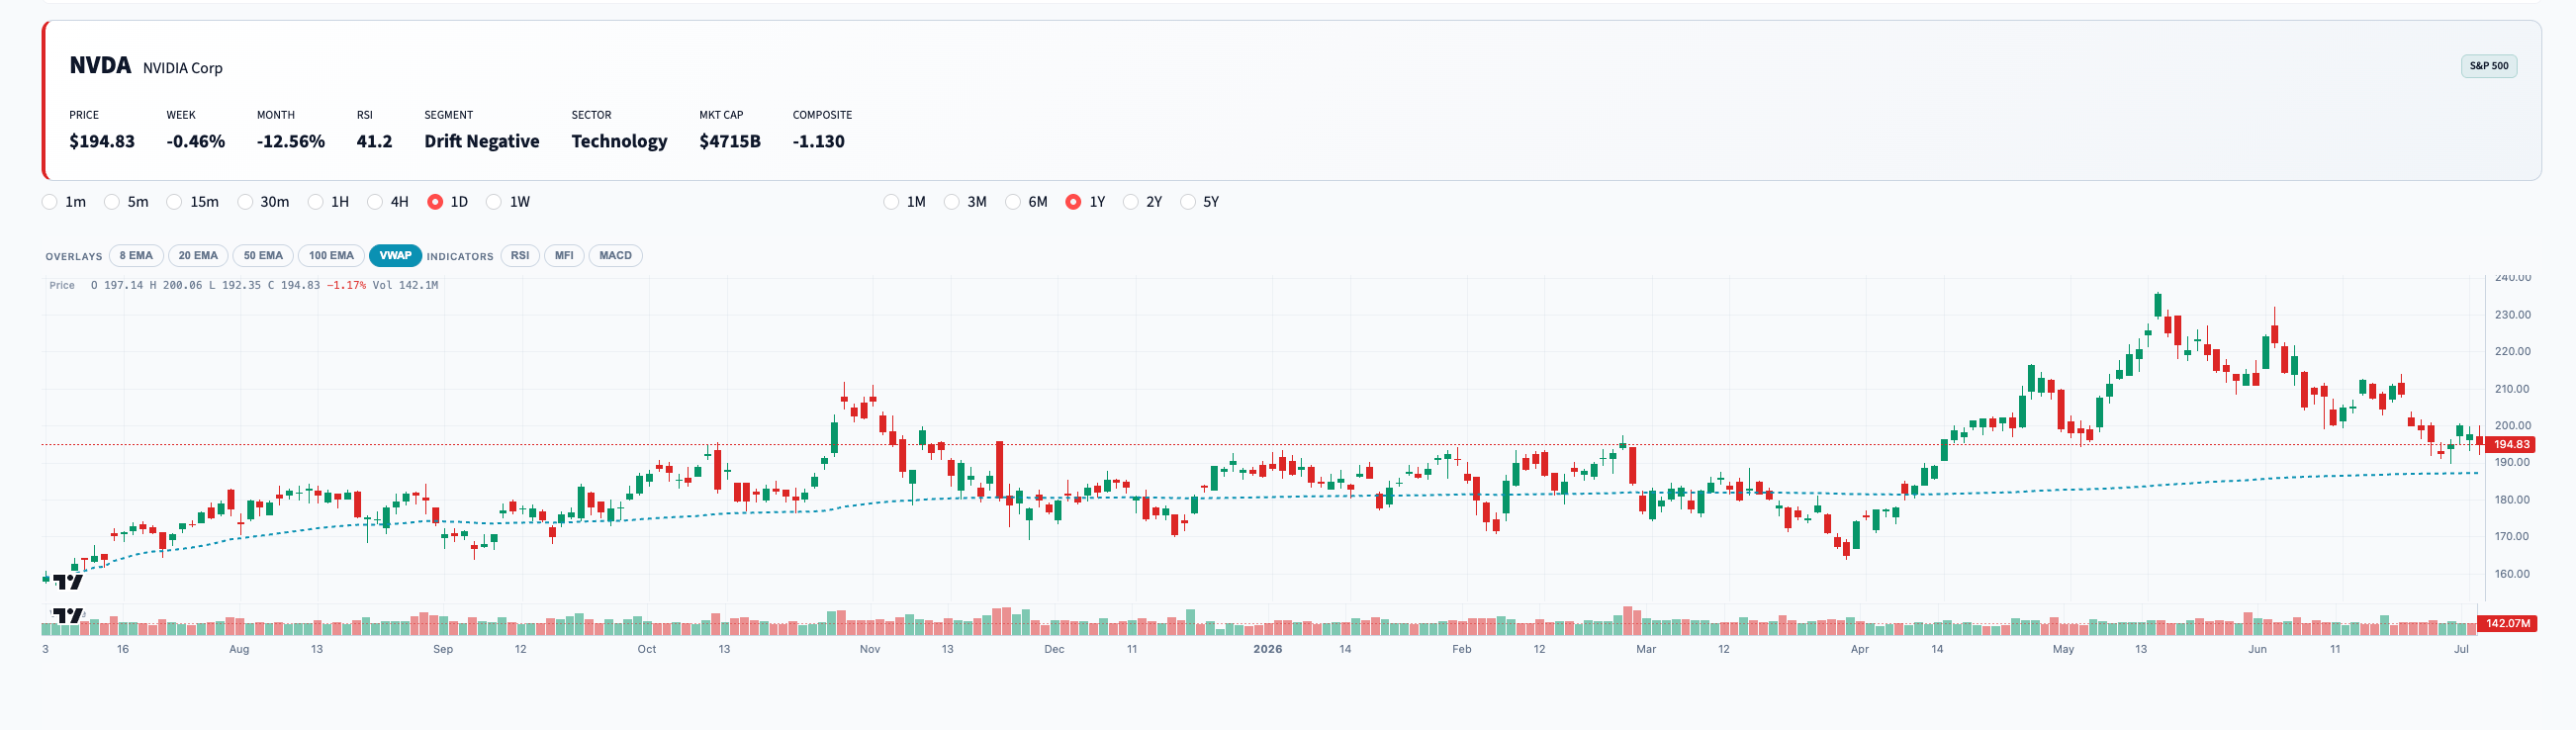
VWAP has become the single most important tool in all of this… and it’s VERY easy to trade because you’re just looking at lines and risk management. If you’re not a member of what we do here… here’s your chance. We just upgraded a number of tools that are included in our Money Printer Pro site that include our momentum signals, our charting technology (you can ditch other monthly subscriptions for that)…
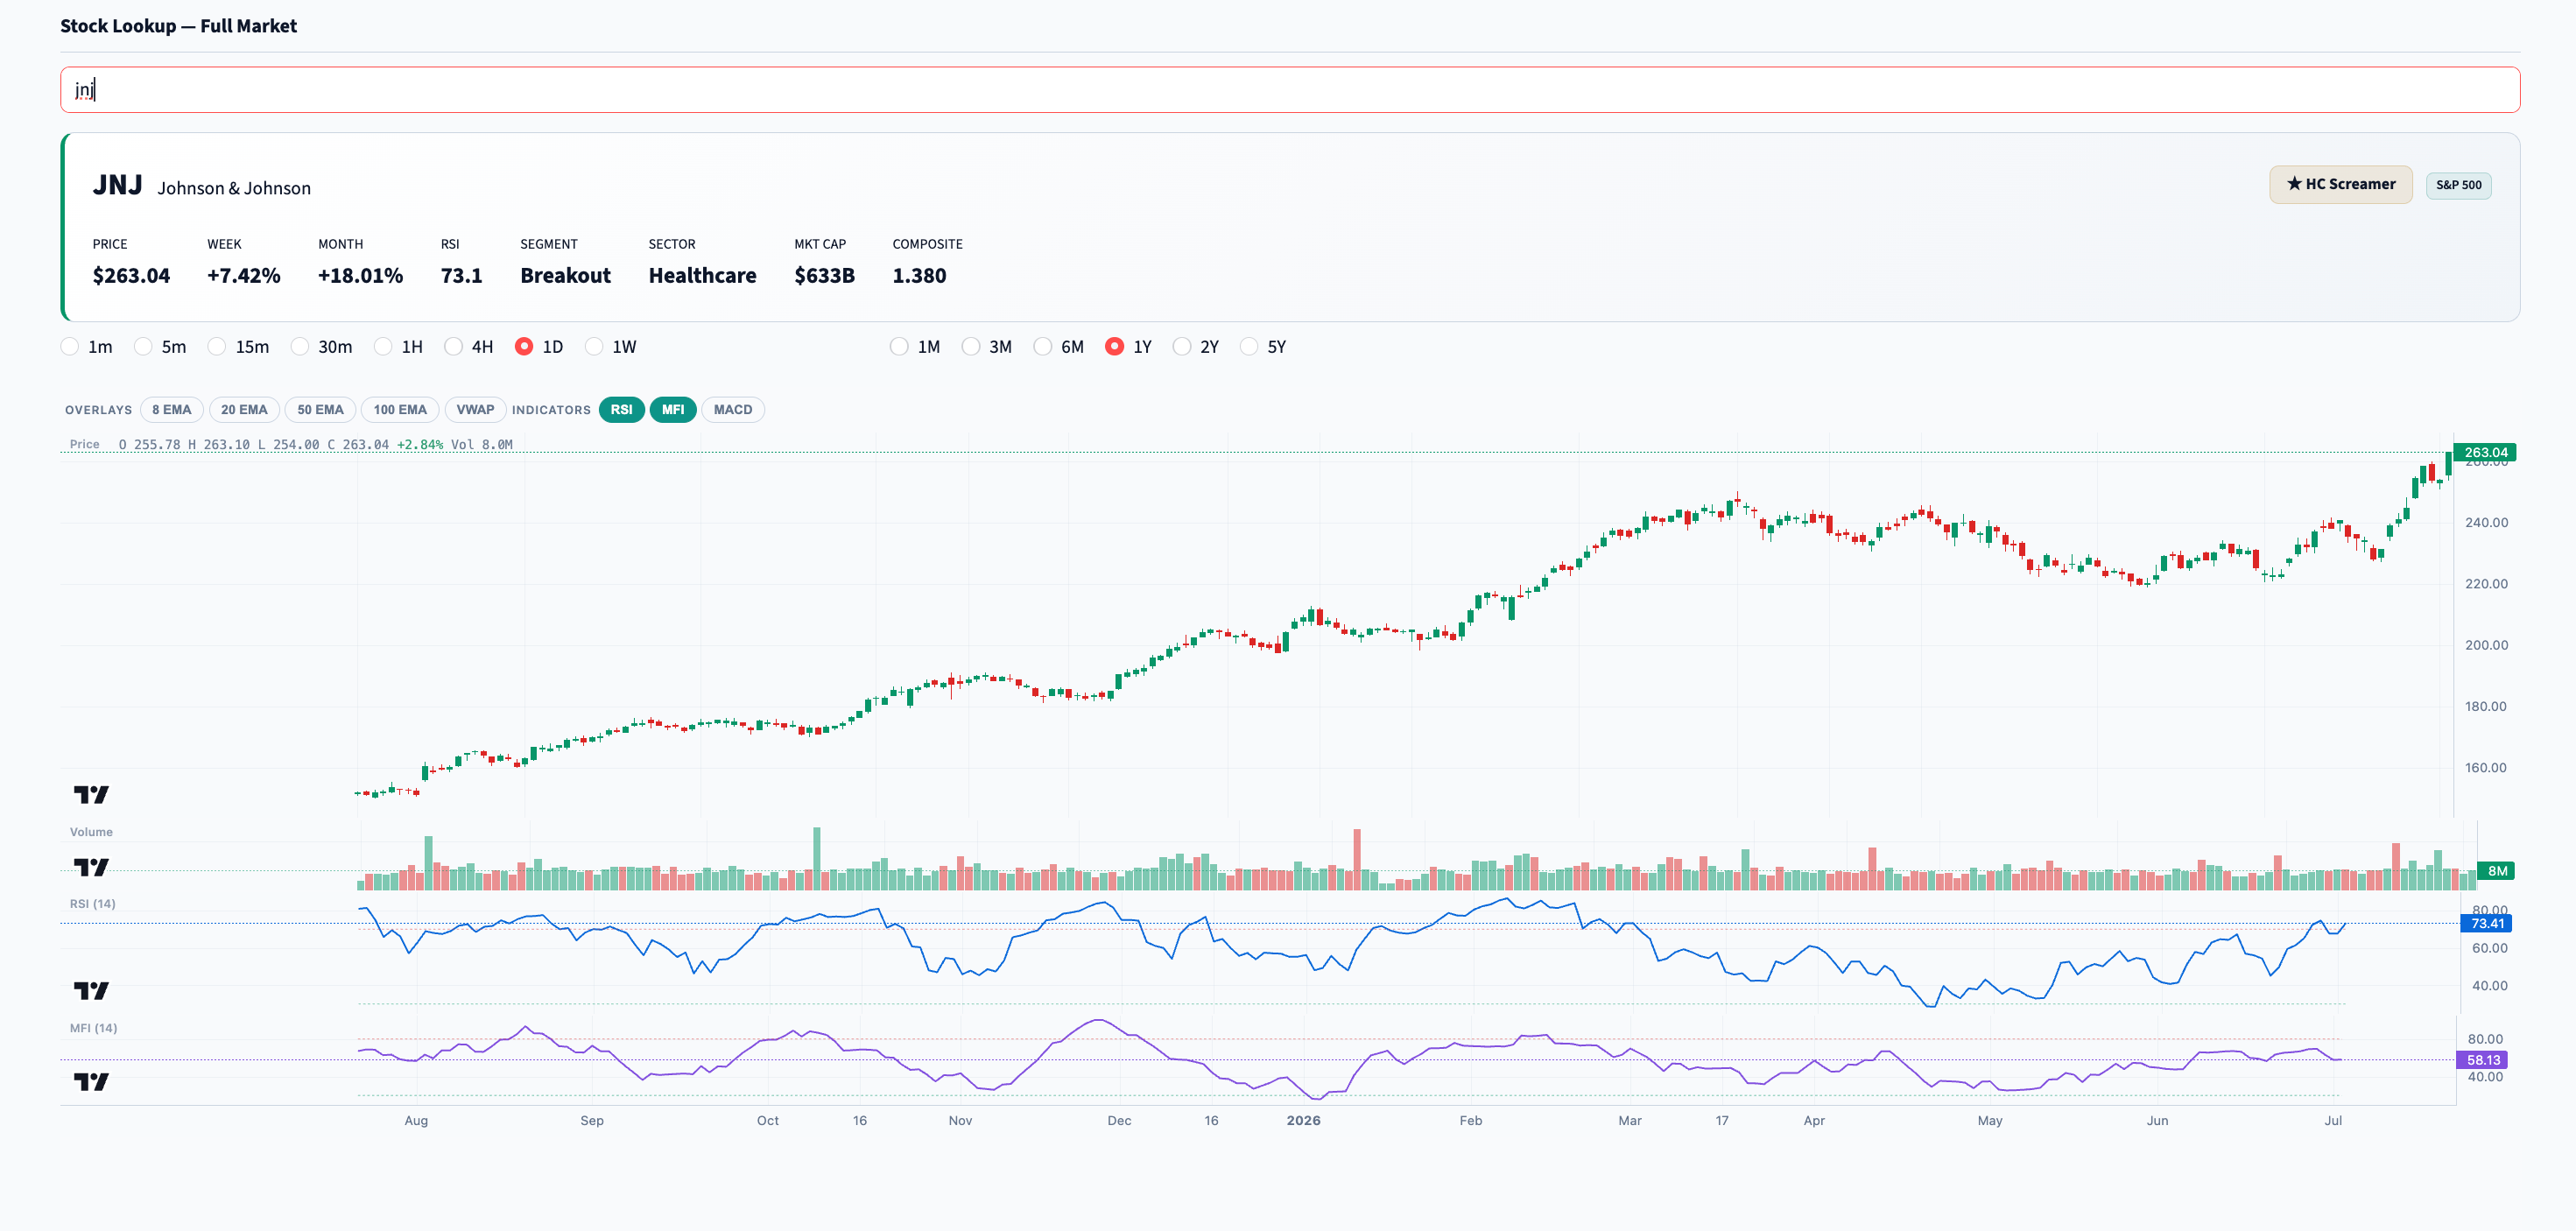
Here’s a 30% discount for your first year… I’d say that the value of all this stuff is probably in the $800 a year range… We are charging less than $20 a month…
Oh…
For our Elite - we build a fundamental machine that covers all of the important numbers that people have to pay for. Seriously, that Elite tool… it’s probably worth $1,200 a year based on the number of subscriptions that I’ve eliminated from other sites out there. We drank a bunch of Corona Lights on a Friday and said… what if we just built these tools and sold it for 30% of fair market price.
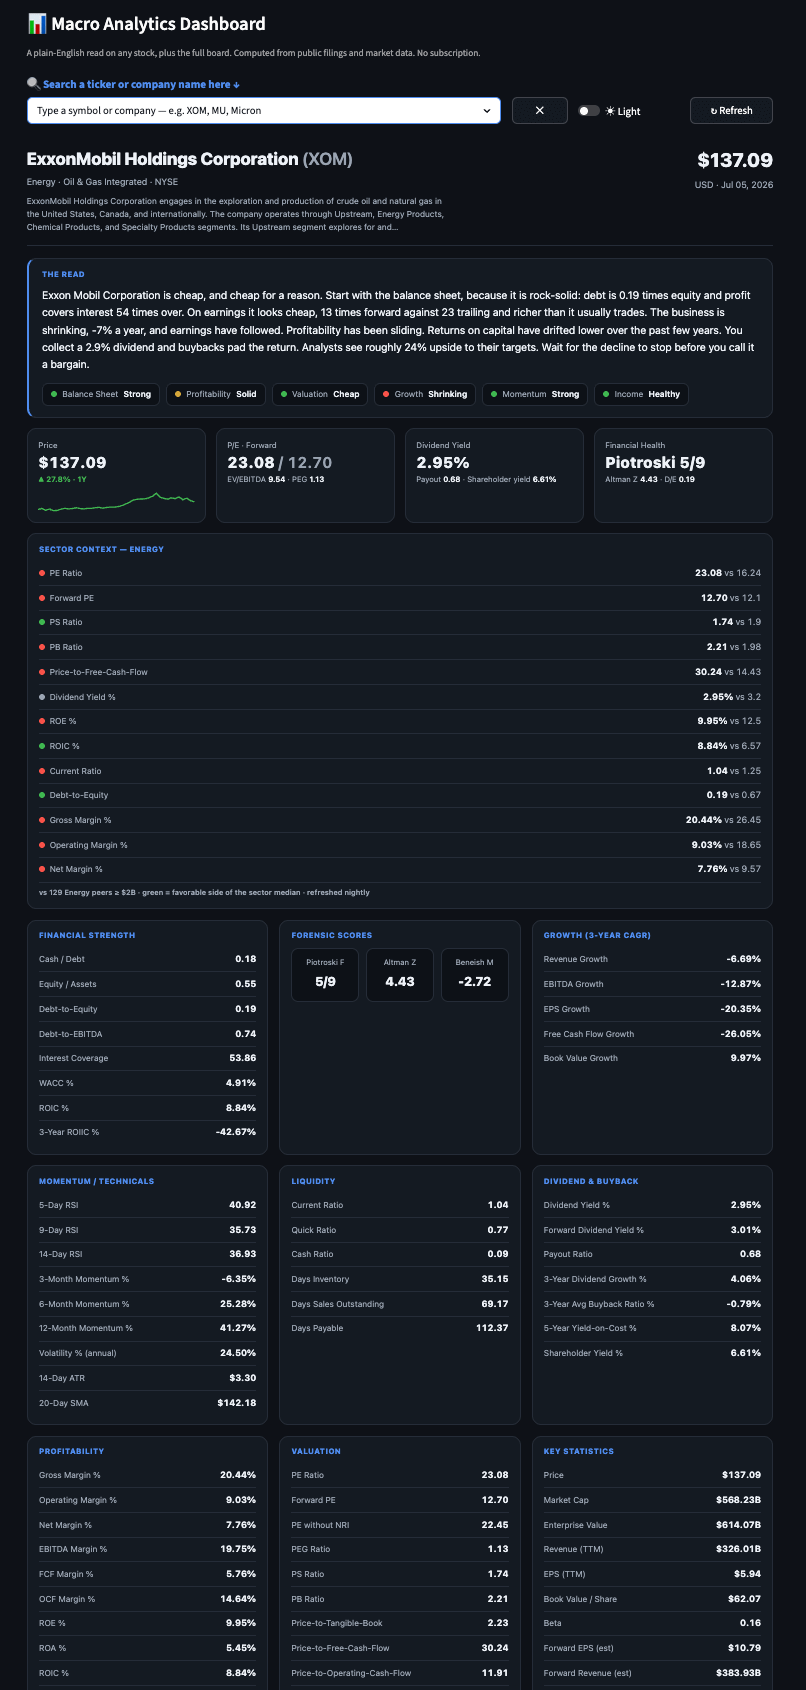
This thing is insane…
Elite is $300 a year… It’s going to be $1,000 a year for people who aren’t members of it now at the end of the year, because I’m realizing that it’s way too inexpensive…
Chart No. 3: They Keep Buying the Dip
Why wouldn’t retail keep buying the dip? The Fed has eliminated the cap on repo management? The Fed is increasing its balance sheet? The whole thing is a self-licking ice cream cone… Yes, fundamentals matter… but that’s largely at the Russell 2000 level. It’s a perpetual bailout machine, and the BIS damn near admitted this…
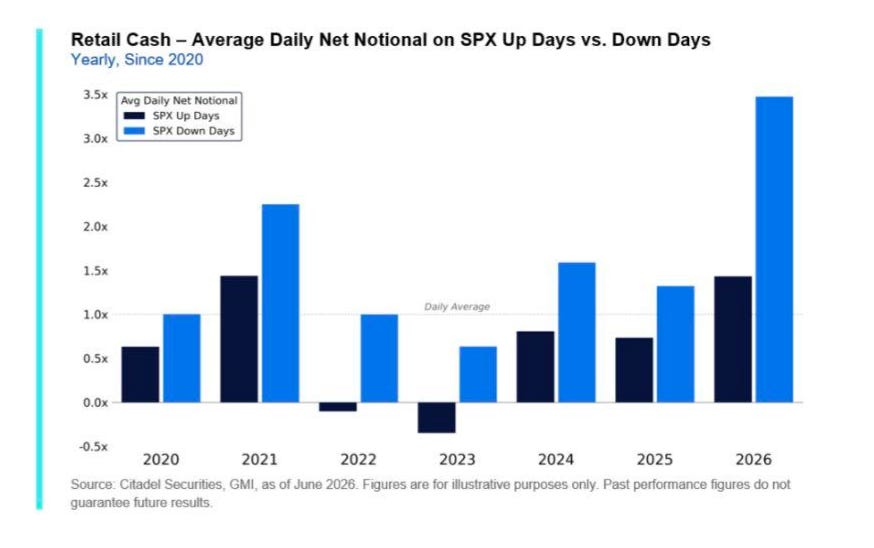
They eliminated the free market in 2008… 2020… and 2022… and yet, they’re still blaming capitalism for all of our problems. It’s a joke.
Chart 4: Momentum Got Smoked
It’s been a tough few days for momentum, which is what I constantly highly in our paid morning sessions. Our Poor Man’s signal went negative on Thursday, and it’s very clear that the market has serious exposure to Japan and Korea…
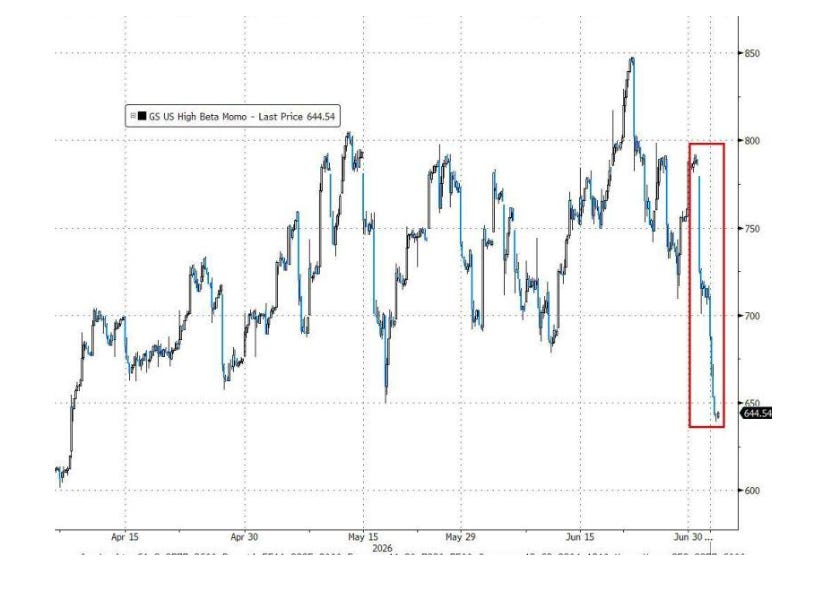
I’m keeping a very close eye on the iShares MSCI USA Momentum Factor ETF (MTUM), which is down about 6.7 in the last five days.
Be cautious… Japan remains our problem…
Chart 5: Biggest Quarterly Jump Since 2020
They’ll tell you that it’s earnings… but earnings live downstream of momentum and liquidity. They’ll also tell you that it’s optimism… even as the jobs numbers are bad…
They’ve been printing money since December. The Treasury went activist at the start of the quarter. The forced buying compounded in the second week of April.
It was primarily passive and mechanical…
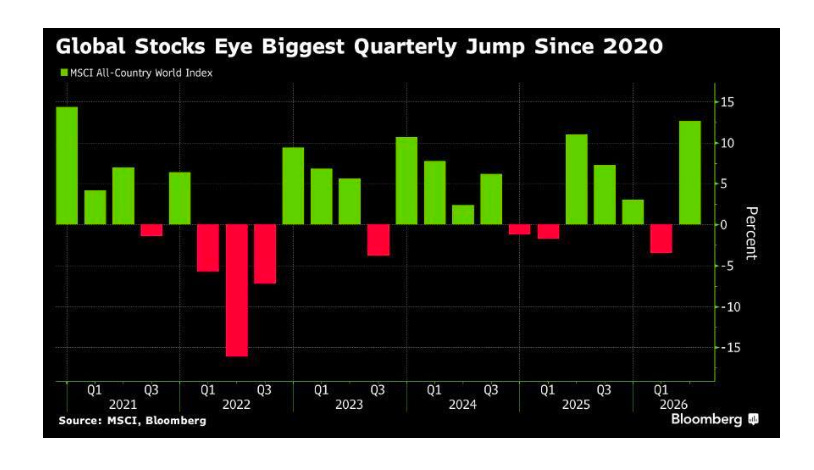
Do not allow them to suggest anything else.
That’s it…
Stay positive,
Garrett Baldwin
Exceptional writing.
Reminds me of a quote from Wall Street Journal, "The Wall Street Journal describes U.S. equities as the "least-dirty shirt," suggesting that despite fiscal challenges, they represent the safest investment compared to struggling global markets". Granted, I imagine this is a general statement and is looking at the macro level.