
Six Tools And a Firetruck...
The Treasury Department's actions are more important than ever... Did we just see a playbook or a massive coincidence?


Dear Fellow Traveler,
In the last two years, we’ve witnessed one market rescue after another.
Japan’s stimulus announcement in November 2025. Its guidance shift in August 2024…
Trump was canceling Liberation Day in April 2025. Recent 2026 press conferences about peace while bombs fell. One after the next… pulling this market back from the brink, just before capitulations and margin calls could fuel another tailspin.
Which brings us to the last three weeks.
Actions that appear to have escaped the financial media, market pundits, and others are wondering where this sudden optimism is coming from.
The question isn’t whether the U.S. Treasury intended to stabilize markets. The question is whether its cash management had that effect.
Sure… this might be basic “liquidity talk…” a story for many readers that says “So what…”
All you’re doing is explaining the plumbing…
Yes. That’s the point.
In a world where capital flows drive market behavior, people don’t understand the flows.
In a financial world obsessed with the Federal Reserve, most Americans don’t know what the Fed does…
So, what chance do we have that they know what the Treasury Department can do?
Beep Beep Goes The Fire Truck
Between late March and mid-April, the Treasury General Account… the U.S. government’s checking account at the Federal Reserve… dropped from roughly $837 billion to approximately $697 billion.
That’s around $140 billion in two weeks (and over $200 billion at its peak).
Then, tax day pushed it back to $924 billion as of April 15.
The TGA sits on the Fed’s balance sheet as a liability… and so do bank reserves.
When the TGA goes down, reserves generally go up… close to dollar for dollar, all else equal.
Roughly $140 billion left the Treasury’s account and showed up as increased reserve balances in the banking system.
Whether intentional or not, the timing coincided with a period when the market was deeply oversold. When the MOVE Index - telling us the volatility in the bond market - was at its high of the year…
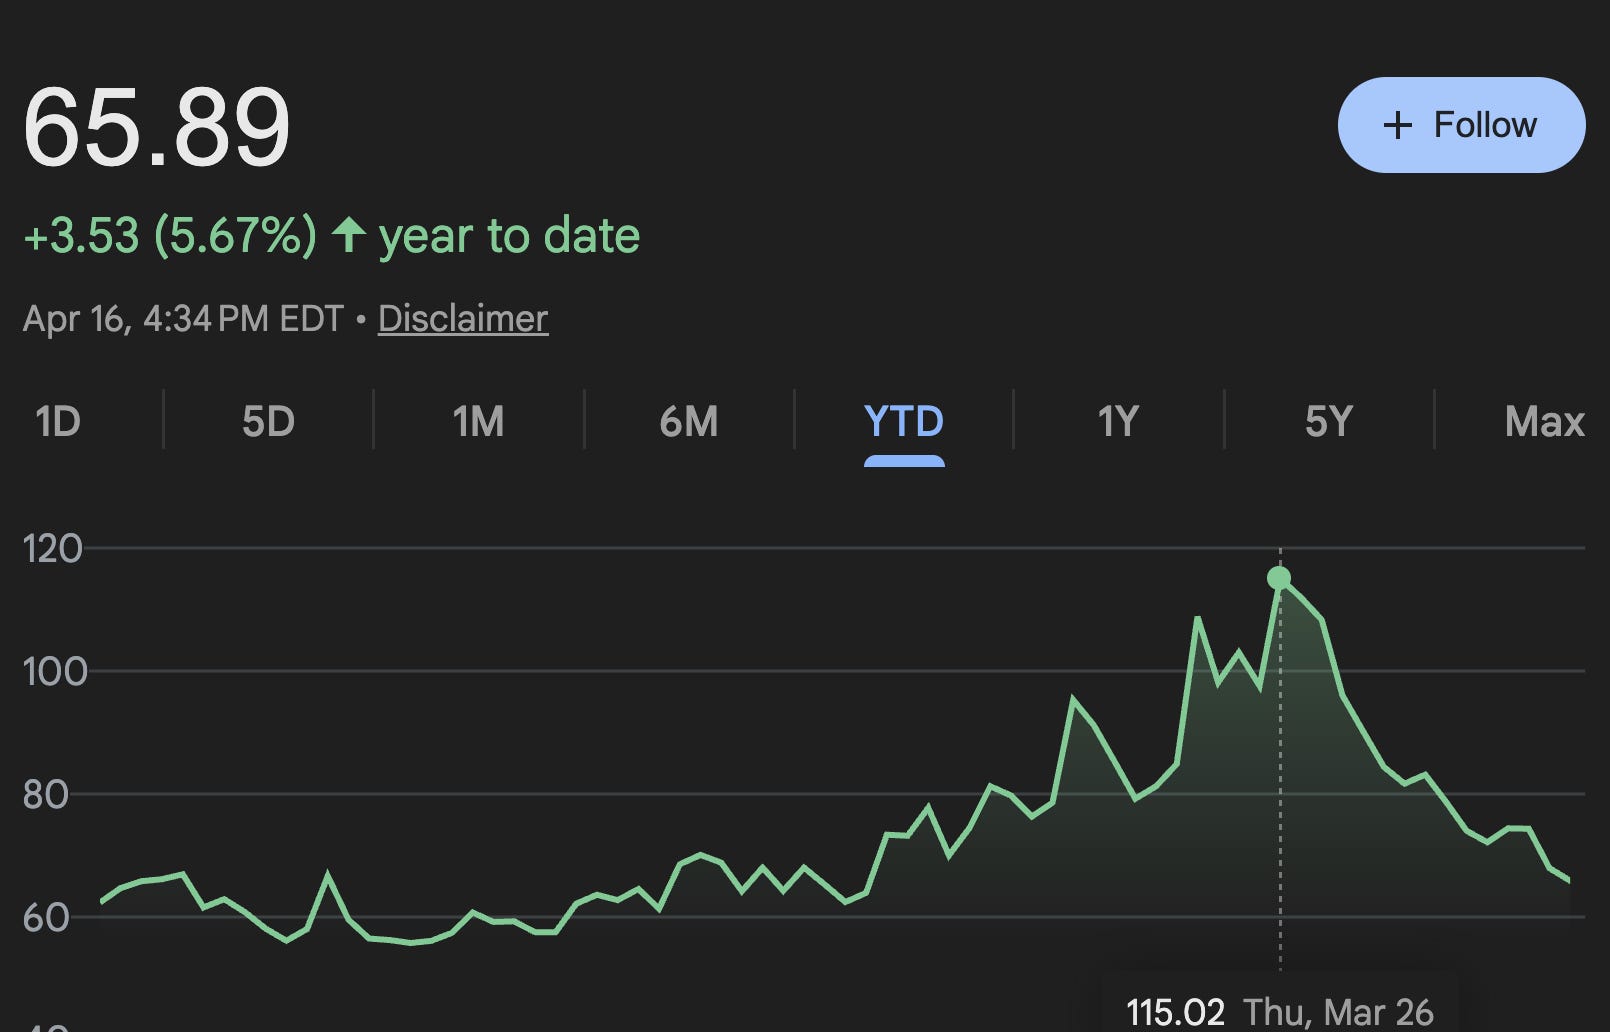
The Treasury didn’t hold a press conference. Scott Bessent didn’t announce a new program. He didn’t need to.
The Treasury’s balance sheet appears to have moved roughly $140 billion of liquidity into a stressed system… before tax flows reversed much of that injection.
It’s Not QE. And Tax Refunds Aren’t Enough.
I want to be precise here because the internet loves to call everything QE.
Stubbed your toe? QE. Flight delayed? Stealth QE.
Ordered a coffee and got charged $9? That’s definitely QE.
Quantitative easing expands the Fed’s balance sheet.
Basically, the Fed buys bonds, credits reserves, and holds a press conference.
A TGA drawdown doesn’t expand anything. In essence, total liabilities stay the same. The math says that one line item goes down, and another goes up.
But when reserves increase, the system’s tolerance for stress increases.
Banks and dealers suddenly have more cash relative to their obligations.
Funding markets loosen at the margins.
Repo rates can stabilize.
And balance sheets don’t need to contract as quickly to stay compliant.
That matters because volatility is not just about valuation… It’s about forced behavior.
When reserves are tight, a small drop in asset prices can trigger margin calls, which force selling, push prices lower, and trigger more margin calls.
Liquidity disappears exactly when it’s needed most.
When reserves are abundant, that same initial shock doesn’t cascade as easily.
Dealers can intermediate, and funds can meet margin without liquidating core positions. The system absorbs stress instead of amplifying it.
So the impact of a TGA drawdown isn’t that it “creates demand” for equities.
It’s that it reduces the probability of forced selling… and in markets, removing sellers is often more important than creating buyers.
Markets don’t break because everyone changes their mind at once.
They break because someone or “someones” is forced to sell… and no one has the balance sheet to take the other side.
Now, there’s a counter-argument here…
The argument is that this drawdown is “not a strategy.”
It’s maybe just the IRS sending refund checks.
And that’s not wrong… tax refunds do drain the TGA.
But refund season typically peaks in February and early March.
This drawdown started on March 25. More importantly, the Daily Treasury Statement shows that the Treasury redeemed roughly $1.06 trillion in maturing bills but issued only about $960 billion in new bills.
That’s approximately $100 billion in bills that matured and were not replaced.
That scale of net bill paydown appears to reflect cash management choices… though not necessarily a market-timing decision.
It doesn’t line up cleanly with typical refund seasonality, and it’s not explained by refund checks alone.
How Does This Work... And Why
Why bring this up… even on the margins? Because the $200 billion in drawdowns from the peak isn’t exactly a massive amount of money…
Well, when a selloff happens, the damage isn’t necessarily caused by people deciding that equities are now worth less based on future cash flows or expectations.
There’s a plumbing element.
When stocks drop, margin calls go out, and investors who can’t meet those calls are forced to sell… This drives prices lower, which triggers more margin calls, which force more selling.
The doom loop or self-licking ice cream cone feeds on itself.
Think about how we manage fires…
The house doesn’t burn down because of the match. It burns down because the fire spreads faster than anyone can contain it.
A fire truck doesn’t need to soak the entire house right away. It just needs enough water in the second room before it fully ignites… and the chain reaction stops.
The first room still burned, but the house is standing.
That’s what $140 billion (again, $200 billion at the peak) in reserves can do on the margins.
Marginal actions can indirectly ease funding conditions across the system. Funding pressure eases, allowing balance sheets to stabilize rather than contract.
The pressure to deleverage forced positions eases.
The funding that was evaporating starts flowing again…
Once the panic stops, buyers show up on their own.
We saw CTAs flip, and gamma reverses. The fire truck didn’t rebuild the house. It kept the house standing long enough for everyone else to start doing their jobs.
None of this operates in isolation.
Positioning, volatility mechanics, and systematic flows ultimately determine price.
The point isn’t that Treasury cash management caused the rally on its own.
I want to stress this…
It’s that, at a moment when funding conditions were tightening and positioning was fragile, the injection of reserves appears to have alleviated a key source of pressure.
Whether that acted as an accelerant is up for debate… but the timing is difficult to ignore. It’s not the first time we’ve seen this…
The Toolkit
The TGA drawdown isn’t the only tool the Treasury has.
Everyone watches the Fed, since the Fed is the starting pitcher and every camera is on him.
But the Treasury is the entire rest of the roster. And nobody watches the dugout.
The TGA Itself
You build it up, you pull liquidity out. Spend it down, you press liquidity back into the system. This is the relief pitcher nobody talks about. No entrance music. He just walks out of the bullpen, throws $140 billion in strikes, and sits back down. And you had to find it in the Daily Treasury Statement like you were digging through a box score from a spring training game in Dunedin.
Bill-Heavy Issuance
We’ve covered this extensively… The Treasury has been financing the government with short-term bills instead of long-term bonds.
In this strategy, bills mature fast, forcing constant reinvestment through money markets and repo… which keeps collateral and cash turning over more frequently.
If a 30-year bond is a centerfielder who catches the ball and lies on the ground for three decades… a 4-week bill is a rookie who dives, pops back up, and is fielding the next ball before you’ve finished your hot dog.
In recent estimates, bills account for roughly 20% of outstanding Treasury debt.
The Buyback Program
The Treasury repurchases older, illiquid bonds and replaces them with fresh issuance.
This is the front office trading a 38-year-old DH who can’t run to first for two young arms and a draft pick.
The roster doesn’t get bigger, but it gets faster… same payroll, younger legs.
Buybacks don’t add net system liquidity… they reshape the profile.
Refunding Composition
Every quarter, Treasury announces how much it will borrow and in what maturities.
Heavy on long bonds? That’s loading up on aging sluggers with bad knees and no-trade clauses. Heavy on bills and short notes? That’s a roster full of utility players who can play five positions and never miss a game.
Extraordinary Measures
When the debt ceiling binds, Treasury suspends retirement fund investments to free borrowing capacity, often drawing down the TGA in the process. This is the hidden ball trick. Nobody runs it in the majors. It looks ridiculous. But it keeps working, and every time it does the broadcasters act like they’ve never seen it before.
Interaction with Fed Reserve Management
The interaction between Treasury issuance and Fed operations can create reinforcing effects on reserves.
Treasury issues bill-heavy, and the Fed’s reinvestment policy can, incidentally, absorb a portion, keeping reserves flush.
Bessent throws the pitch, and the Fed catches it.
Technically, an independent battery running independent game plans that just happen to accidentally turn a double play every single month. By coincidence, of course.
This Isn’t New
Treasury secretaries have been pulling these levers for years.
In 2021, Janet Yellen inherited a TGA balance of roughly $1.6 trillion and drew it down to near zero by late that summer.
You can see the entire drawdown on the FRED series WTREGEN if you want the receipts. Here’s the drawing from early 2021 to the end of the year…
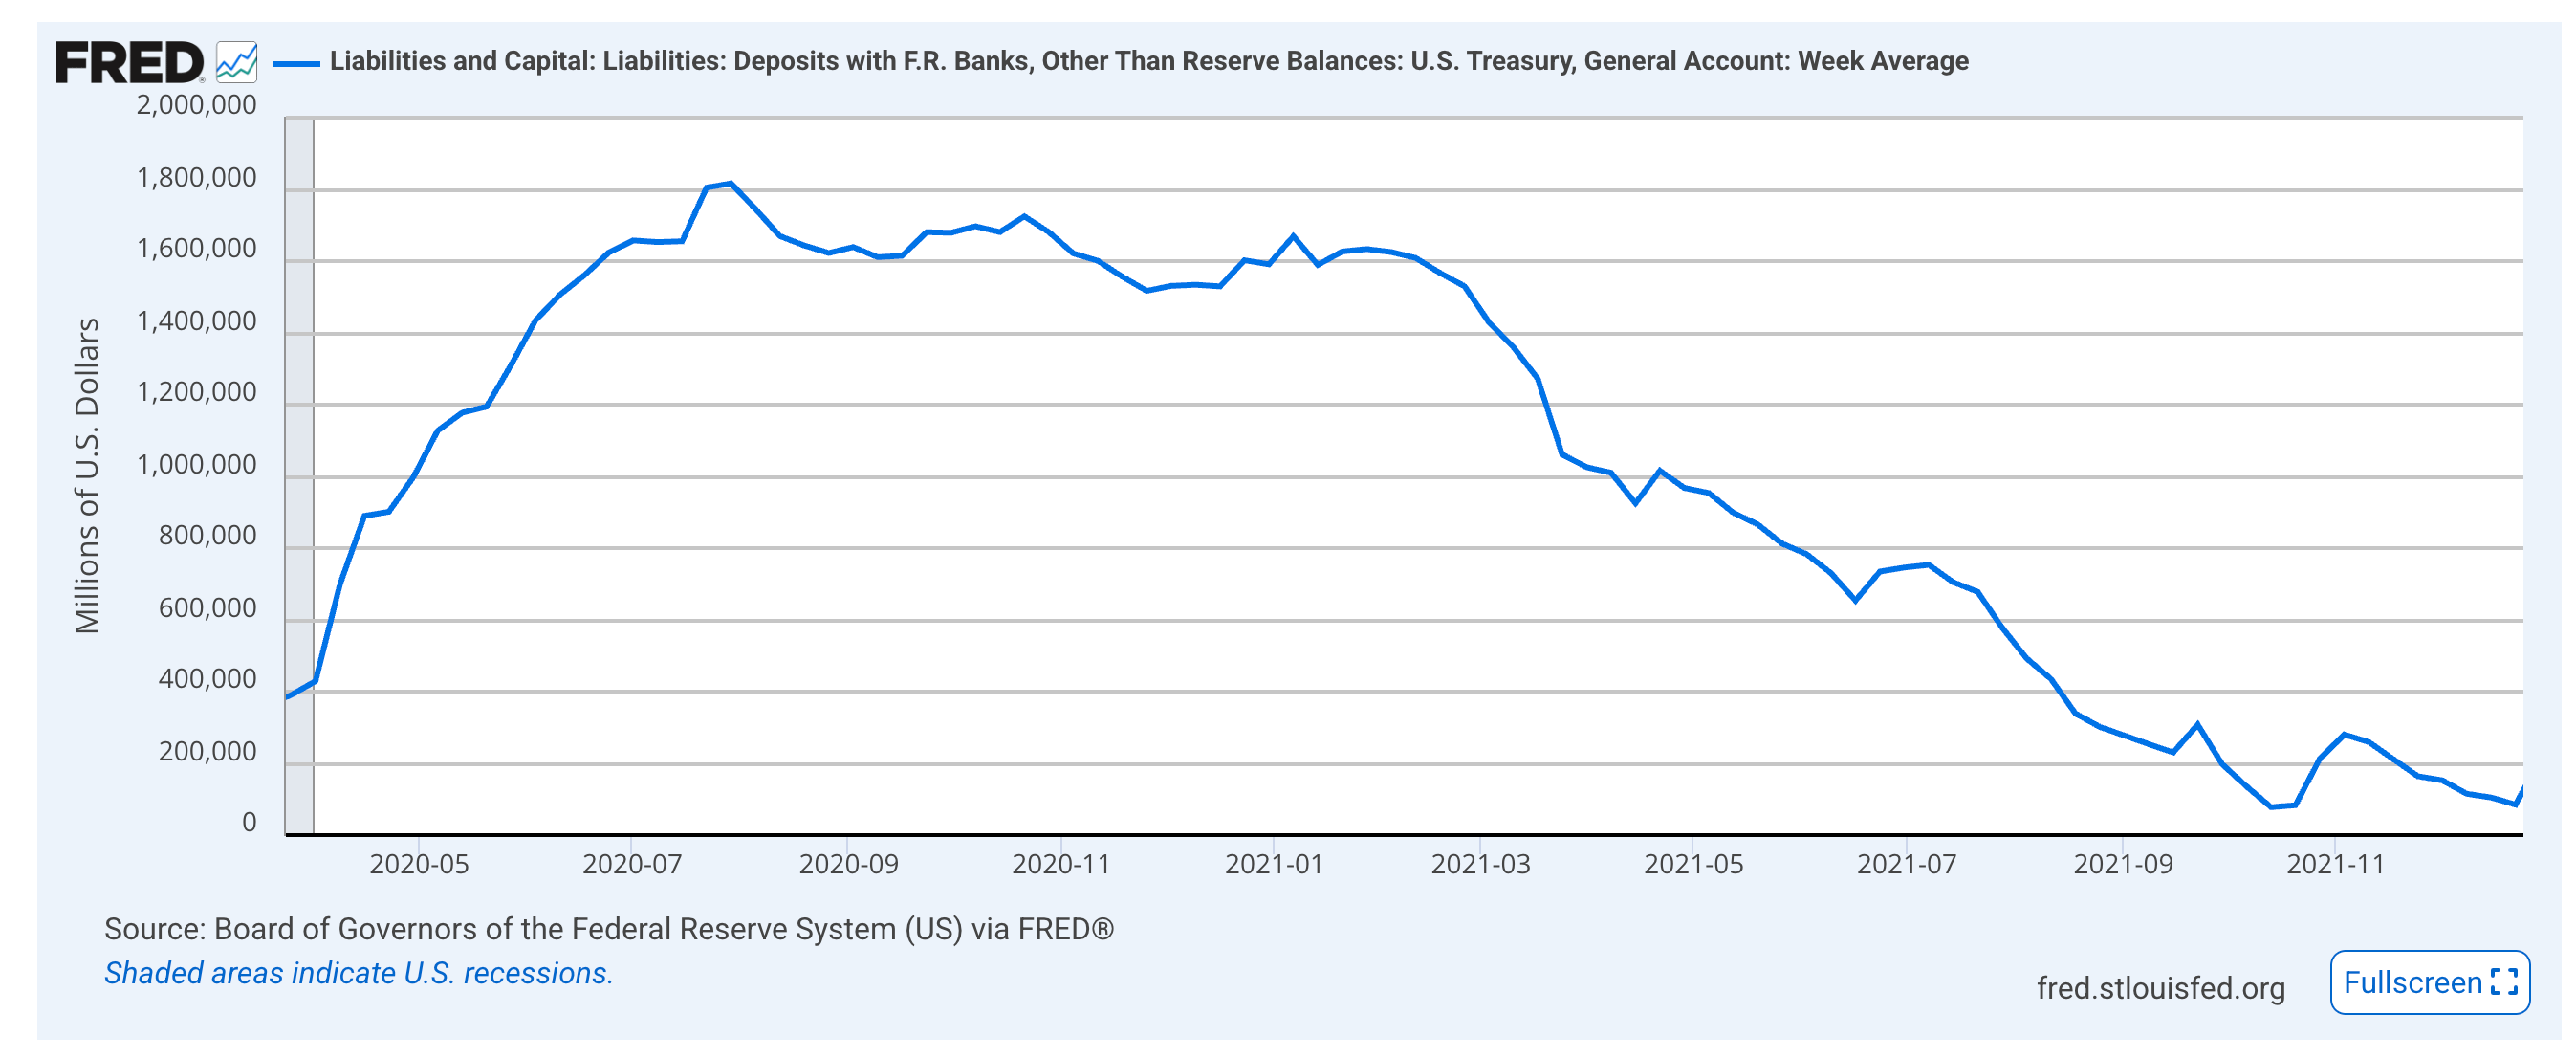
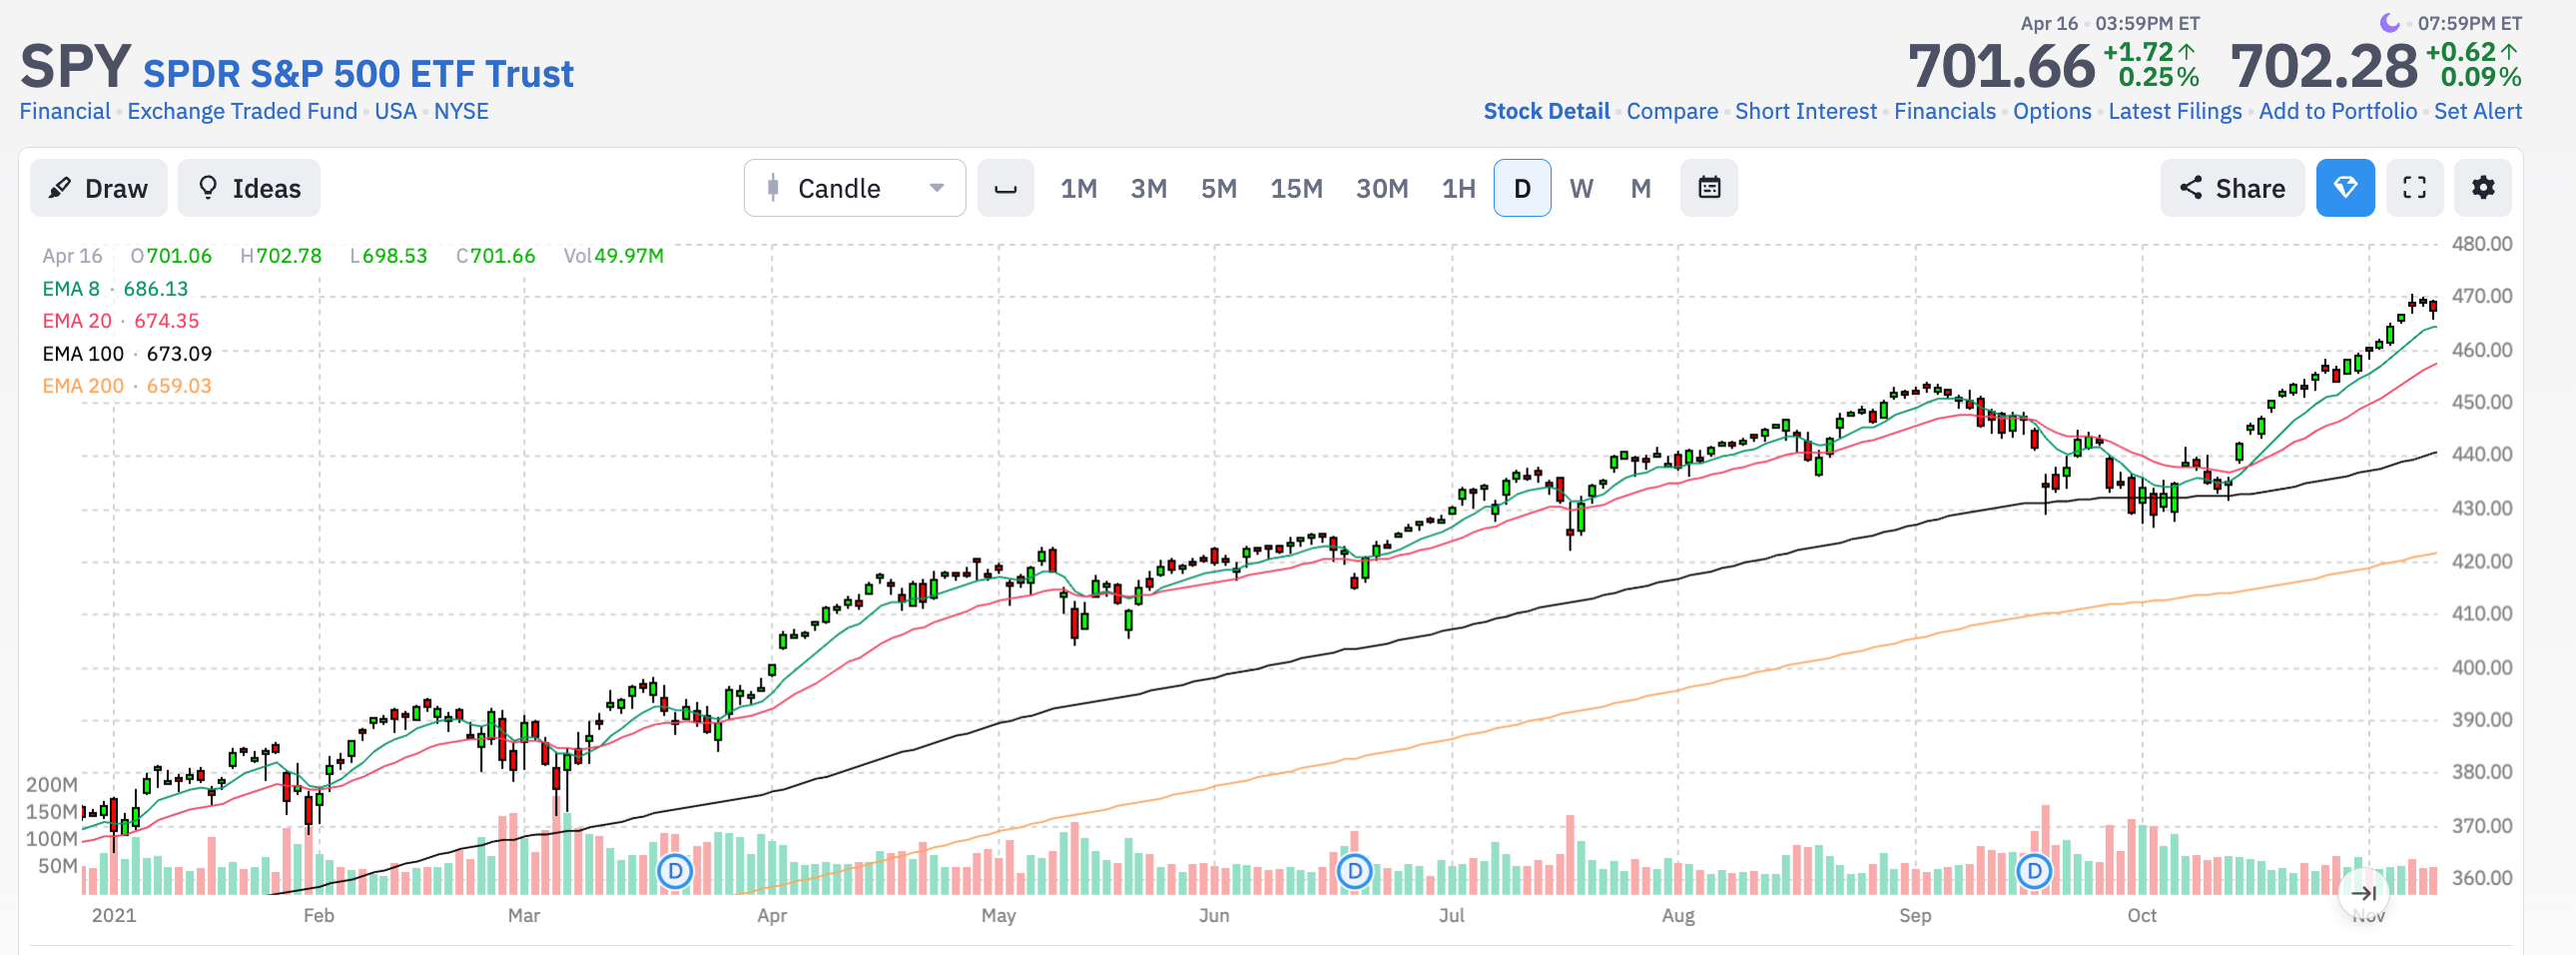
I will note… and you’re allowed to tell me if I’m crazy… that the pick up in this drawdown in February 2021 coincided with a rebound in the S&P 500… for the duration of the year…
At the same time, many of the COVID-related momentum stocks started to break down across the market. That month coincided with a peak in names like ARK Innovation Fund (ARKK) and meme names of the post-COVID year.
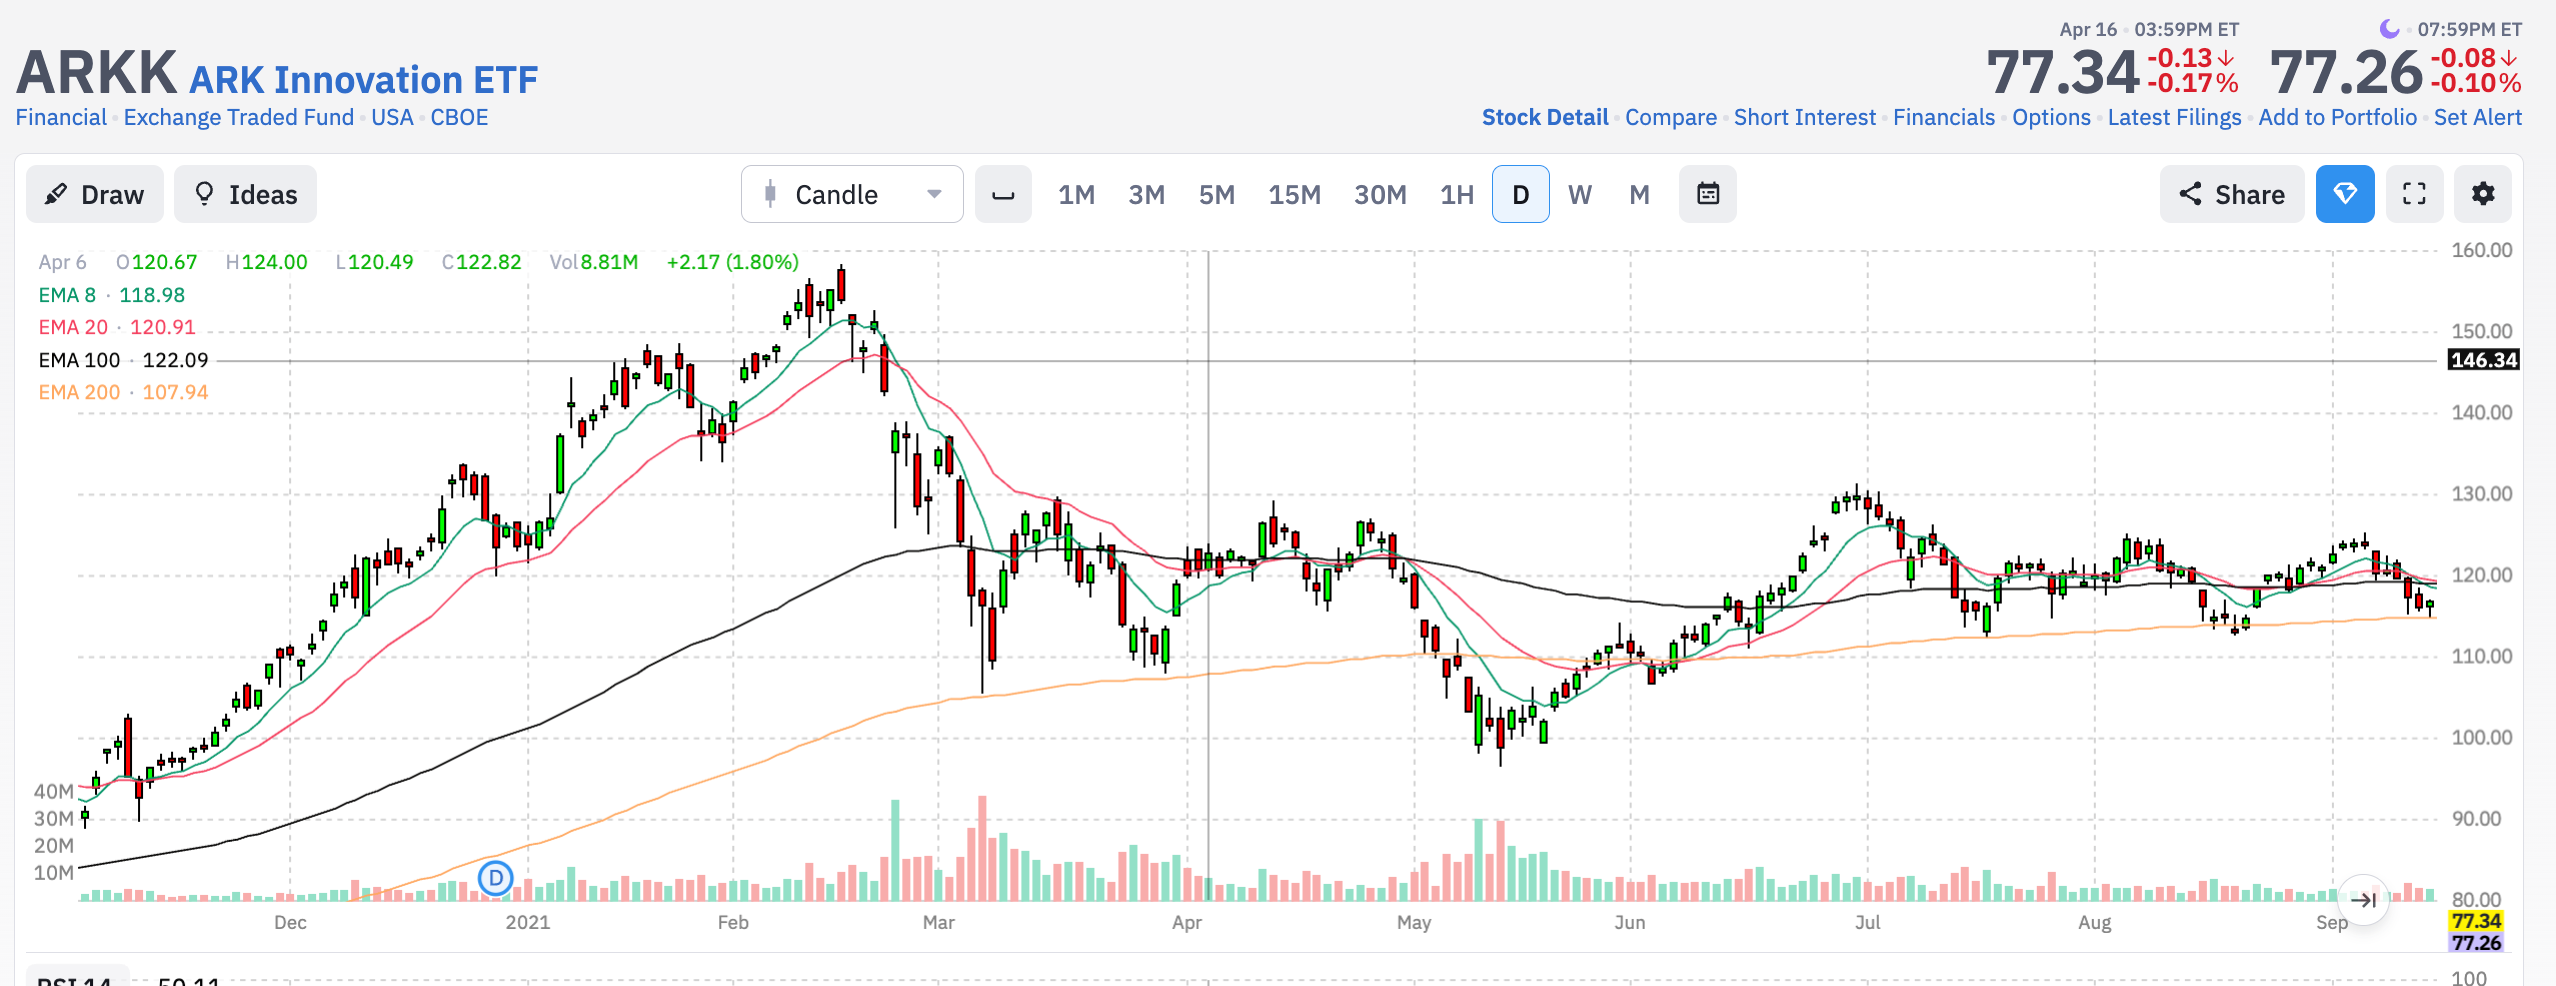
Just a coincidence… right?
During the 2023 debt ceiling standoff, the TGA dropped from roughly $573 billion in late January to approximately $23 billion by early June… over half a trillion drained into the system in four months.
After the ceiling was suspended, Treasury issued over $1 trillion in bills to refill the account, only to pull that liquidity right back out. The ON RRP absorbed much of the excess during the drawdown, which is exactly why the current episode hits harder… that buffer is gone now.
The Fed’s own researchers have studied this. Annette Vissing-Jorgensen at the Federal Reserve Board published work on TGA fluctuations and their effect on the Fed’s balance sheet.
The IMF published a working paper on repo market volatility and the debt ceiling.
The NY Fed, the OFR, and the BIS have all documented how Treasury cash management interacts with reserve levels and funding markets.
It’s a toolkit deployed in plain sight.
The Receipts
I went through four weeks of the Fed’s H.4.1 release to trace the cash.
From March 25 to April 1, the TGA dropped from $837.4 billion to $803.6 billion.
That’s a $33.9 billion drop. Reserves rose from $3,036.1 billion to $3,064.5 billion. That’s up $28.4 billion. SOMA data suggests roughly $14.8 billion in reinvestment-related flows that week, adding reserves on top of the TGA drawdown.
From April 1 to April 8, TGA dropped from $803.6 billion to $697.1 billion.
That’s down $106.5 billion. Reserves rose from $3,064.5 billion to $3,183.5 billion. That’s up $119 billion.
The Fed reinvested another $16.1 billion or so.
That puts roughly $122.6 billion in reserve-increasing flows into the system over seven days, and reserves went up by $119 billion… the numbers broadly align.
From April 8 to April 15… It’s Tax Day, and the TGA jumped to $924.4 billion. That’s up about $227.4 billion, while reserves dropped to $2,980.2 billion.
Those are down $203.3 billion. The cash that flooded in got sucked right back out.
All the while, the domestic reverse repo facility… the Fed’s ON RRP, where money market funds park excess cash overnight… was effectively near-empty the entire time.
It sat at $777 million, $2.1 billion, $177 million, and $223 million. In prior TGA drawdowns, some of the cash would get absorbed by the RRP.
But that buffer is gone, so every dollar from the TGA went straight to reserves because there was nowhere else to go.
The drain started around March 25… the same week the NFCI began to show modest loosening. The fire truck arrived before most people even smelled smoke.
Tomorrow afternoon, the next H.4.1 arrives.
If the theory holds, it should confirm the post-tax-day stabilization.
What This Means
There are six tools in the kit, all influencing liquidity conditions simultaneously.
There was $140 billion in reserves with no RRP buffer to absorb any of it.
There is currently a bill-heavy issuance keeping collateral turning over in money markets.
There’s the Fed’s reinvestment policy, incidentally absorbing a portion.
There were CTAs adding billions in mechanical buying.
There was dealer gamma flipping from ceiling to accelerator… all while the NFCI was loosening.
This wasn’t one player having a hot night. This was the entire lineup producing in the same inning while the opposing manager was still arguing a check swing from the third.
The risks haven’t disappeared.
The question is always the same… what happens when an auction fails, when rates spike faster than the bills can roll, when the TGA runs dry, and there’s nothing left to spend down.
Those are real concerns. But every Treasury secretary for the last decade has had this toolkit, and every one of them has used it.
So, if you’ll excuse me, I now need to go create a new project that keeps an eye on CTA behavior… actions at the Treasury, and whatever the desks at Goldman are saying about forced buying and forced selling on the horizon…
Stay positive,
Garrett Baldwin
Garett, did the Treasury draw down its reserves this tax season more than usual?
FYI, Craig Peterson & Michael Green publish daily CTA positioning in their Market Situation report at Tier 1 Alpha.