


The $300 Trillion Question
You will be buying all this debt whether you know it or not.


Dear Fellow Traveler:
Here’s the Bravos Research chart that should be stapled to the forehead of every central banker on Earth.
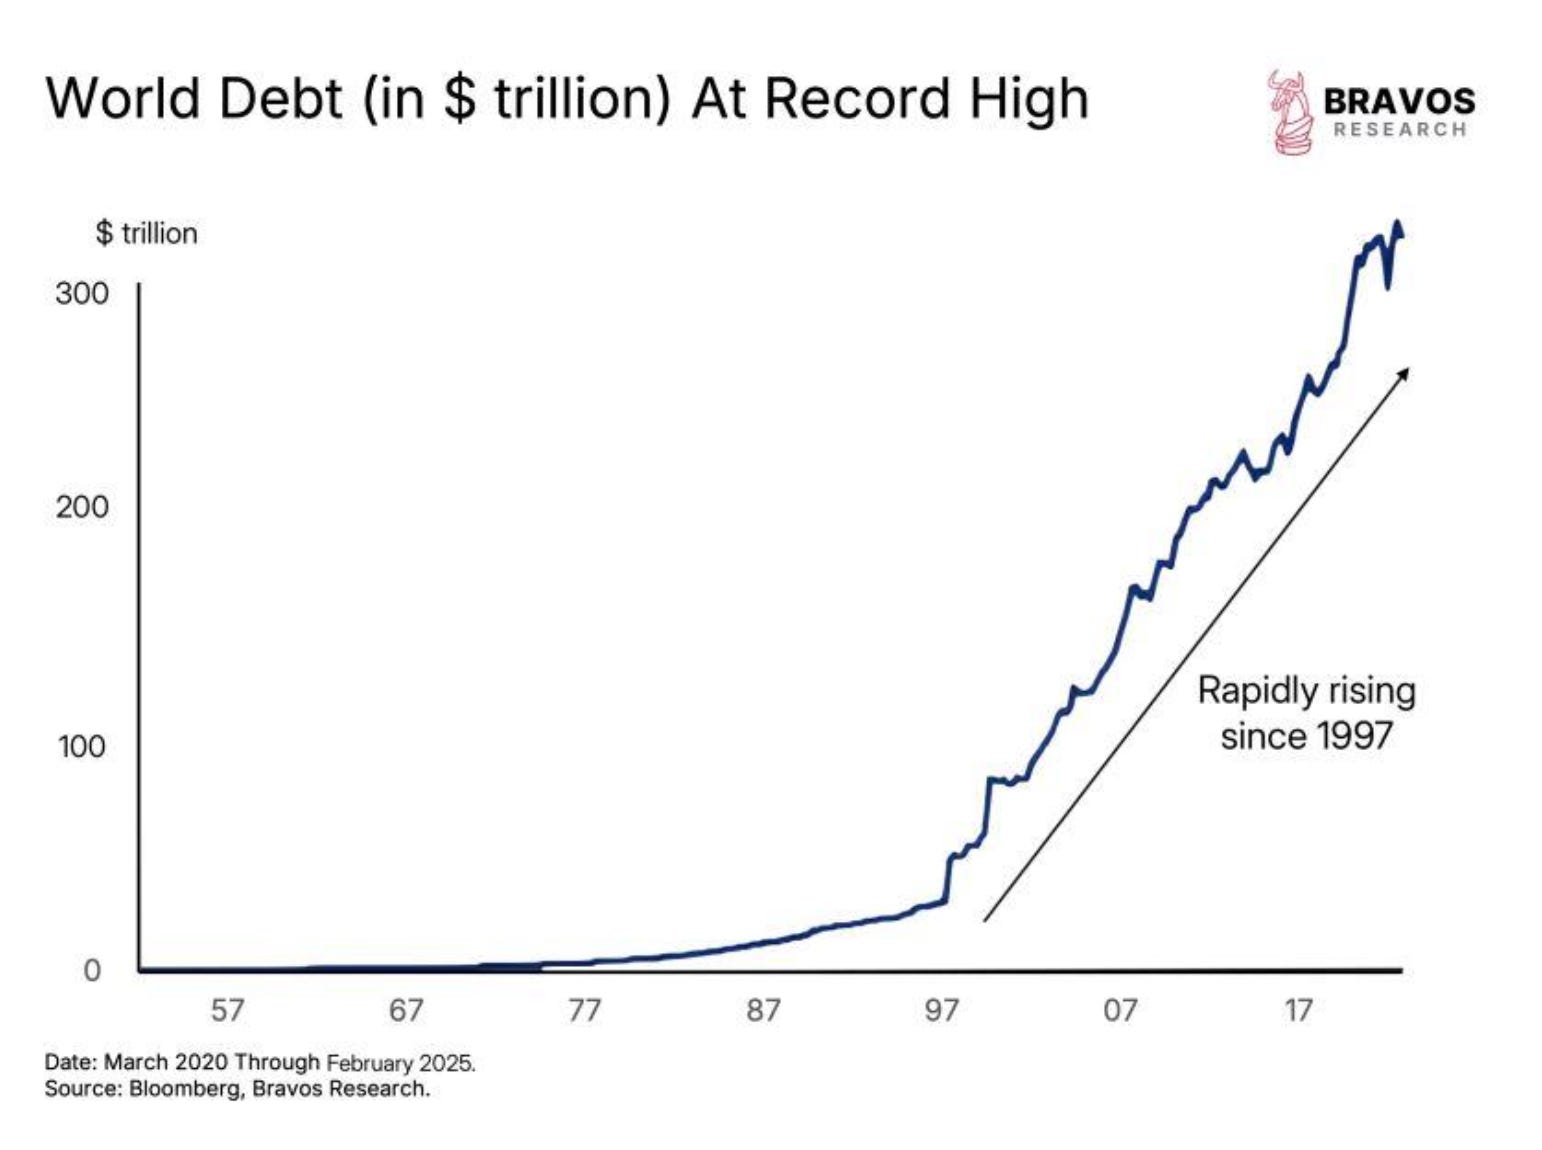
It shows global debt rocketing past $300 trillion, a steep line that looks less like a macro trend and more like vital signs for anyone facing a margin call one day....
$300 trillion is roughly $37,500 for every man, woman, child, monk, hermit, and off-grid goat farmer on Earth.
But the real question isn't how we got here.
It's what comes next. Because we're not just talking about total debt, we're staring down the barrel of a refinancing tsunami that the system may be unable to absorb.
The Refinancing Wall Nobody's Ready For
Here's some back-of-the-napkin math: the official figure is that about 30% of global debt matures in the next 2–3 years. The reality is that it’s probably about 20% annually…
But even using the “official estimate,” it’s still $90 trillion to $100 trillion that needs new buyers of debt that will be used to refinance existing debt.
According to the World Bank, global GDP is only about $105 trillion.
CrossBorder Capital says the global liquidity pool is about $175 trillion.
But this is where it gets tricky.
Global savings available for investment?
Maybe $25–30 trillion, but that's a stretch.
So who, exactly, is supposed to buy all this debt?
1997… When Debt Went Vertical
Debt has been growing steadily since the 1980s, right after deregulation kicked off in the U.S. and the financial sector learned to bend reality.
But 1997 was the real inflection point.
That year, we experienced the Asian Financial Crisis, a warning shot that accelerated capital mobility, reserve accumulation, and dollar dependency.
Then came the euro in 1999, which created a massive, unified capital market without a unified fiscal policy. Meanwhile, shadow banking, off-balance-sheet leverage, and derivative-fueled credit expansion exploded.
Credit creation divorced itself from deposits, and the world never looked back.
From that point forward, debt grew exponentially while economic growth stayed stubbornly linear.
The Liquidity Mirage
Post 2008, things got really insane.
Investors have spent the past 15 years bathing in artificial liquidity. Central banks printed, rates dropped, and everyone bought everything.
Markets got drunk on yield suppression.
And now? Now the hangover hits.
Consider the current lineup of buyers for all this needed debt to refinance EXISTING debt…
Central banks already have $30+ trillion in assets, and most can't sell them without blowing up their bond markets.
Pension funds are still limping from 2022's bond crash, risk-averse and yield-starved.
Foreign governments?
According to U.S. Treasury TIC data, China and Japan are net sellers, not buyers.
Banks got burned by duration mismatches and face regulatory pressure with the Silicon Valley Bank crisis.
And retail investors?
They're too busy trading meme stocks to bankroll your sovereign debt rollover.
The Math That Breaks the System
The viral stat says $300 trillion at 5% equals $15 trillion in annual interest, 15% of global GDP. It's dramatic, but the nuance is that $300 trillion includes household, corporate, and government debt.
Not all of it rolls at the current 5% rates.
A more realistic global weighted average is closer to 3–3.5%.
But even at that rate, you're looking at $9 trillion to $10 trillion in annual interest, or nearly 10% of global GDP.
That's to keep the machine from seizing, not to repay a dime.
This is the silent tax of financial repression.
Capital is being devoured to service the status quo.
So what comes next?
The Biggest Margin Call in History
Every dollar that goes toward refinancing government debt is a dollar that doesn't go into stocks, real estate, or productive innovation.
This is the classic "crowding out" effect, but on steroids.
The U.S. Treasury will roll over trillions in the next 18 months.
The EU needs trillions.
Japan? Trillions.
And where does that money come from?
From the same global capital pool that's also supposed to fund your stocks, startup, vacation home, AI bubble, and next SPAC.
Something's gotta give.
This isn't just about numbers.
This is about a monetary system hitting terminal velocity. When debt grows exponentially and the economy doesn't, the system isn’t sustainable.
So… you get three options…
Central banks capitulate and QE comes back, inflation be damned.
Rates collapse, financial repression returns, and savers get destroyed.
Or we see selective defaults where some borrowers—corporate or sovereign—get left behind.
I see the money printer in the future—either No. 1 or No. 2, with a history tilting toward Fiscal Repression.
We're all complicit.
Your 401(k), pension, and retirement plan depend on this absurd debt machine continuing.
If it stops, everything else falls.
That’s why we dance around it. Central banks "monitor." Governments posture. Investors pretend that 5% coupons make up for the risk.
But under the hood, this isn't a functioning engine; it's a game of musical chairs powered by $300 trillion in IOUs, and we're praying the music never stops.
The debt chart isn't just a financial curiosity.
It's a warning flare.
A system built on infinite credit can't survive a world with finite capital.
And right now, that system is trying to refinance at 5% or more interest while growth stalls and buyers vanish.
There isn't enough liquidity.
There isn't enough yield.
There isn't enough faith.
The only question left is: What will break first… the currency, the bond market, or the social contract?
Place your bets accordingly.
If you’re looking for insight on when these financial events are likely to happen, we’re here at Capital Wave Report.
Otherwise, I wish you well on your journey. The seas will be rough on this journey.
Follow the Sovereign strategy to protect your wealth and shield against inflation… Because real assets are what will matter most.
Stay positive,
Garrett Baldwin
The Receipts: Bravos Research, World Bank, U.S. Treasury TIC data