


Why This Sell Off is Different (So Far)...
Executives are dipping a toe in, but something else feels a bit more

Dear Reader:
With NVIDIA offering a small bump and Trump’s new tariff plans announced, markets are weak this morning.
Our Equity Strength Signal is still red (since last Friday), and there hasn’t been any real sign of improvement with the S&P 500 still chasing its 50-day moving average.
Unlike other negative events, this selloff has been different.
And not in a good way.
We’re relying on our old friends in the boardroom to showcase why…
Quickly look at this chart before we dig into the real problem.
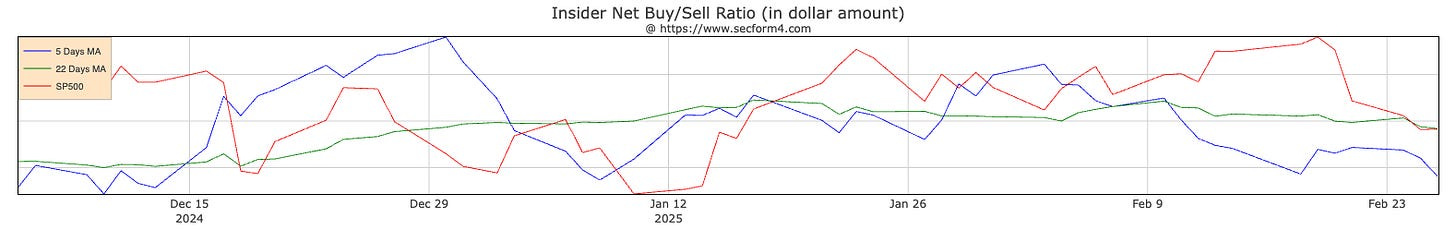
The blue line in the chart below is the five-day moving average of Insider Buying to Selling in aggregate dollars. The higher the blue line, the greater the buying pressure ratio.
This ratio measures every dollar spent on company stock by executives compared to every dollar generated through sales on a five-day aggregate line dating back through December 2024. We’re ONLY looking at three months to start this conversation.
It was very strong at the end of December. But right now, selling has accelerated - and that’s all happening while blackouts on buying are being lifted from earnings season. Blackout periods tend to end a few days after they report earnings.
On a dollar-for-dollar basis, executives like CEOs and CFOs, board directors, and owners of 10% or more of the company are collectively staying on the sidelines.
When our signal goes negative, it typically accompanies some larger event that ties up the plumbing of the global financial system. A few days after the signal goes red, we usually see the market fall sharply in a few days… higher volatility… and panic in the retail side of the investment world.
So… let’s get to why this period
The chart below highlights key events in the last three years accompanying negative signals before larger selloff.
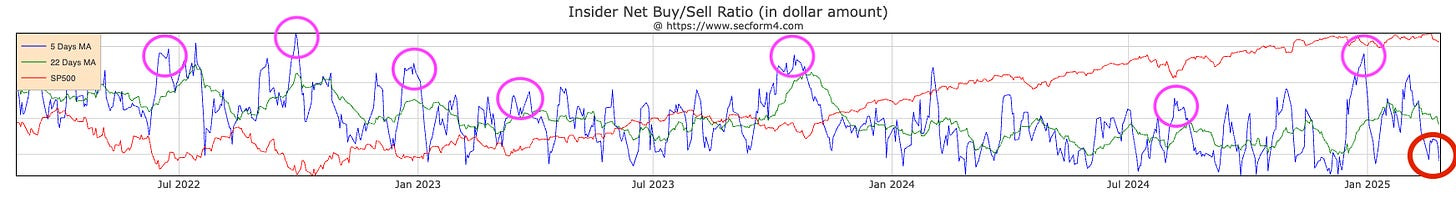
Following these deeper selloffs, insiders bought in droves.
The elevated blue line shows this, with insider buying outpacing insider selling by a sizeable amount.
The circles are the periods of more extreme insider buying than selling over the aggregate period.
You can see that buying gets very strong during these short-term spasms in the market. The pink circles highlight those bottoms that accompany strong executive buying. But the red circle, that’s where we are today.
This is critical because it tells us that the executives likely don’t believe the bottom is in right now. And that says something, considering the list of other events highlighted above. They are, in order:
The pre-June 2022 Quad Witching selloff - the biggest selloff among hedge funds in 15 years.
The September 2022 GILT Crisis in England required the Bank of England to pivot and coordinate among central banks.
The December 2022 tax harvesting selloff preceded large stimulus efforts by the People’s Bank of China and continued monetary support as the markets emerged from their liquidity cycle bottom that fall.
The March 2023 Regional Banking Crisis required new policy efforts by the Federal Reserve to provide emergency liquidity support to the banking system.
The October 2023 Bond Yield Surge - which accompanied large outflows prior to Bill Ackman again signaling some bottom in the market after the 10-year hit 5%.
The August 2024 Nikkei Crisis - a four sigma event (which happens every 63 years), and required the Bank of Japan to alter forward guidance to calm the markets slightly.
The December Quad Witching Selloff - a negative signal on December 10 that took us into a heap of selling and bottomed on December 19, 2024.
Now, we have our first major negative signal of 2025 - and we’re coming out of the strongest selling pressure we’ve seen since mid-2022.
And yet, insider buying on the aggregate isn’t that significant.
So - what is going on here?
I argue there are two issues at play.
The first is stateside.
With Trump’s tariff plans, executives are playing “wait and see” with their money.
They either know what tariffs could do to their companies through extensive modeling and research/consulting or are waiting for policy decisions to see if deals are struck between nations.
The second issue relates to my odd feeling about Japan in recent weeks.
A little digging can show us that the media was asleep at the switch and didn’t dig enough under the hood from the 2003 Silicon Valley Banking crisis.
We’ll recall that in March 2023, the Federal Reserve provided ample support to the U.S. banking system through the Bank Term Funding Program (BTFP) [but you guys, totally remember, it’s not stimulus even if it provides the same outcomes that stimulus does].
So, what went underreported was that the Federal Reserve had also added Norinchukin Bank, Japan’s fifth-largest bank, to its Standing Repo Facility list.
Naturally, this signalled underlying issues. That bank has been in a freefall for the last year - and what is significant right now is that the company had planned to dump $63 billion in U.S. and European bonds by… March 2025.
In June 2024, Bullion Exchanges wrote the following:
With approximately 23 trillion yen in foreign bonds, accounting for 42% of its 56 trillion yen in assets, Norinchukin's significant liquidation is likely to trigger a broader sell-off in the market. The bank holds a substantial portion of foreign bonds in Japan, and its decision to sell could prompt other banks to follow suit.
One of the other things noted was the expectation that the Federal Reserve would begin slashing rates at a more aggressive pace - which would mitigate some of the losses faced by the bank. But now the problem is that the Fed isn’t in any rush to lower rates - unless we have a recession - all while inflation is rising in Japan.
I am keeping my eye on both the tariff situation and Japan’s banking system.
This should continue to be a bumpy road through Quad Witching in March.
Let’s get to the morning signals…
Keep reading with a 7-day free trial
Subscribe to Me and the Money Printer to keep reading this post and get 7 days of free access to the full post archives.