
Money Printer 102: What Do You Mean by Momentum?
If you can bring a market signal down to a measurable, repetitive equation, wouldn't you just want to do that and fuse it with other important indicators?


Dear Fellow Traveler,
“Momentum is working well this month, and the market is running hot!”
You’ve probably heard that quote before. Usually right after a huge equity rally.
After the move already happened.
Has this ever happened to you?
Some guy on CNBC points to an S&P 500 chart and says, “This market is bullish.”
Another guy smiles and says, “That’s true. The trend is your friend.”
A third guy, younger, wearing his first Joseph A. Bank suit, mentions a 1997 backtest.
Then everyone nods. Not because they agree.
But because disagreeing would slow… the… segment… down.
So Kelly Evans asks, “What should investors do with their money today?”
But the three guys… they all remember, at the exact same time, that they’re on live TV.
So if one of them answers that segment-ending question, CNBC cuts to a commercial.
Turns out the guy with the chart bought a new tie for this segment, so he might finally achieve his lifelong dream of being streamed on CNBC Asia.
And the backtest guy told a girl he took to Ulysses on a first date that he’d wink at her on air, but he hasn’t done it yet because he doesn’t know which camera is his camera.
And the guy who said “the trend is your friend” doesn’t actually care about trends. He just wants to say “NVIDIA” on live television so badly that he’s been clenching his fist and punching himself in the thigh over and over under the desk.
So instead, they all smile and point at the chart, and say the same sentences again.
BUT LOUDER.
While Jim Cramer looks at them like he accidentally wandered into a hostage video.

Let’s Get This Back on Track Here
Everyone pretends momentum is just prices going up.
It isn’t.
And it’s definitely not: “Buy what’s green and hope.”
Yesterday, we explained what “Liquidity” means.
Well, momentum is what happens when liquidity doesn’t just exist. It persists.
Momentum is “Plumbing First.”
But most definitions of market momentum start in the wrong place.
They start with behavior, because people think human behavior is easier to explain than structure.
With behavior, it’s all action.
Investors chase winners, underreact to news, and overreact later. Prices drift as trends form. Loud noises.
All of these conditions are true, but the story is incomplete.
People have always been emotional, but markets didn’t always trend as they do now.
What changed in recent decades was the system that allows trends to continue.
Momentum only exists if the financial system allows capital to stay committed.
Not for a day or for a headline. I’m talking weeks, months, maybe even longer.
That’s not a behavioral issue. That, by definition, is a liquidity condition.
Think back to our liquidity example from yesterday’s Money Printer 101.
When your life has margin, you make decisions with confidence.
You don’t worry and micromanage every expense.
Imagine that confidence doesn’t just show up once. It sticks around… for months or even a year.
When you’re liquid, you keep booking trips and fixing things around the house. You assume each month that the following 30 days will remain the same as they were over the previous weeks.
That’s a feeling of persistence, right?
Well, that’s also what momentum looks like.
Markets behave the same way with quiet confidence.
When liquidity is abundant and stable, investors don’t just buy once. They keep buying and keep adding exposure to their portfolios.
They extend the duration of their holdings and take incremental risks.
Prices don’t rise because people are excited, but because there’s no reason to stop buying. There’s no disruption to “the good times.”
Academics Figured This Out (Eventually)
For a long time, finance was taught top-down.
Market participants assumed that any financial theory was correct and that markets would conform to it. When they didn’t, any discrepancy was labeled an “anomaly” and pushed to the margins, where it basically went unstudied for decades.
Momentum didn’t embarrass academia because it broke the rules.
It embarrassed academics by exposing how shallow the rules were.
For decades, financial theory operated under the Efficient Market Hypothesis (EMH), the idea that prices instantly reflect all available information. The argument went that any excess returns were either due to “luck” or compensation for risk. [If you’re a finance junkie, I recommend this 2008 lecture by Dr. Robert Schiller on EMH.]
EMH was a tidy and convenient framework since it didn’t have to explain anything.
It was largely theoretical.
Real markets never behave as the EMH predicts. Capital doesn’t move instantly. Balance sheets have friction, leverage limits, collateral rules, and corporate risk.
All of these things slow the transmission of information into prices.
Meanwhile, money arrives in waves, not constantly. Workers pump capital into markets every two weeks via retirement accounts. Money managers rotate positions on a monthly and quarterly basis.
Everyone reassesses their portfolios at least once, if not twice, a year.
And while that sounds like common sense, momentum lived underneath that reality the entire time.
Finally, in 1993, researchers Jegadeesh and Titman showed that buying stocks that rose over the prior 6 to 12 months and selling those that fell generated roughly 1% per month in extra returns. [Source 1]
It didn’t seem that revolutionary a thought, but it was what came next.
This “momentum effect” showed up everywhere. It would pop up in different countries. It would appear across different company sizes. And the results stretched across different decades.
Meanwhile, Eugene Fama and Kenneth French, perhaps the most respected names in academic finance, built multi-factor models to explain why stocks go up and down.
Things like market risk, company size, and valuation.
But momentum wouldn’t fit their models. Fama called it “the premier market anomaly” and “the biggest embarrassment to the theory” of efficient markets [Asness, Fama on Momentum]
Mark Carhart eventually added momentum as a fourth factor to the standard model, as ignoring it was no longer an option. [Source 2]
The conclusion was awkward. Either markets weren’t efficient (as EMH implied), or something was missing from the structure… Something was: funding conditions.
Research by Cliff Asness, Tobias Moskowitz, and Lasse Pedersen found that momentum works best when borrowing is cheap, markets are calm, credit is available, and risk-taking is easy [Source 3]
This sounds like what Stanley Druckenmiller said about liquidity.
Meanwhile, momentum breaks down during liquidity shocks, funding stress, volatility shocks, and forced deleveraging events.
These key conclusions are an extension of the permission I mentioned yesterday.
When permission persists, trends persist.
Momentum is not an independent signal.
It is a result of liquidity.
Who Actually Uses Momentum
The concept of momentum isn’t just academic theory.
Real money runs on momentum… actually… a ton of it.
AQR Capital Management manages about $189 billion in funds that target momentum. Cliff Asness, who wrote his PhD dissertation on momentum and studied under Eugene Fama, is the founder. [A great podcast on the subject is here]
The fund buys stocks that have been rising and avoids stocks that have been falling.
They do this using computers instead of gut feelings.
Alpha Architect offers an ETF, QMOM, that does the same thing.
Wes Gray, who runs it, wrote the book “Quantitative Momentum,” a great book that Tim Melvin gave me about a decade ago. The fund holds about 50 of the strongest-performing stocks and rebalances monthly.
Vanguard also has a momentum ETF, and when Vanguard packages something, it’s gone mainstream.
And then there’s the leveraged world.
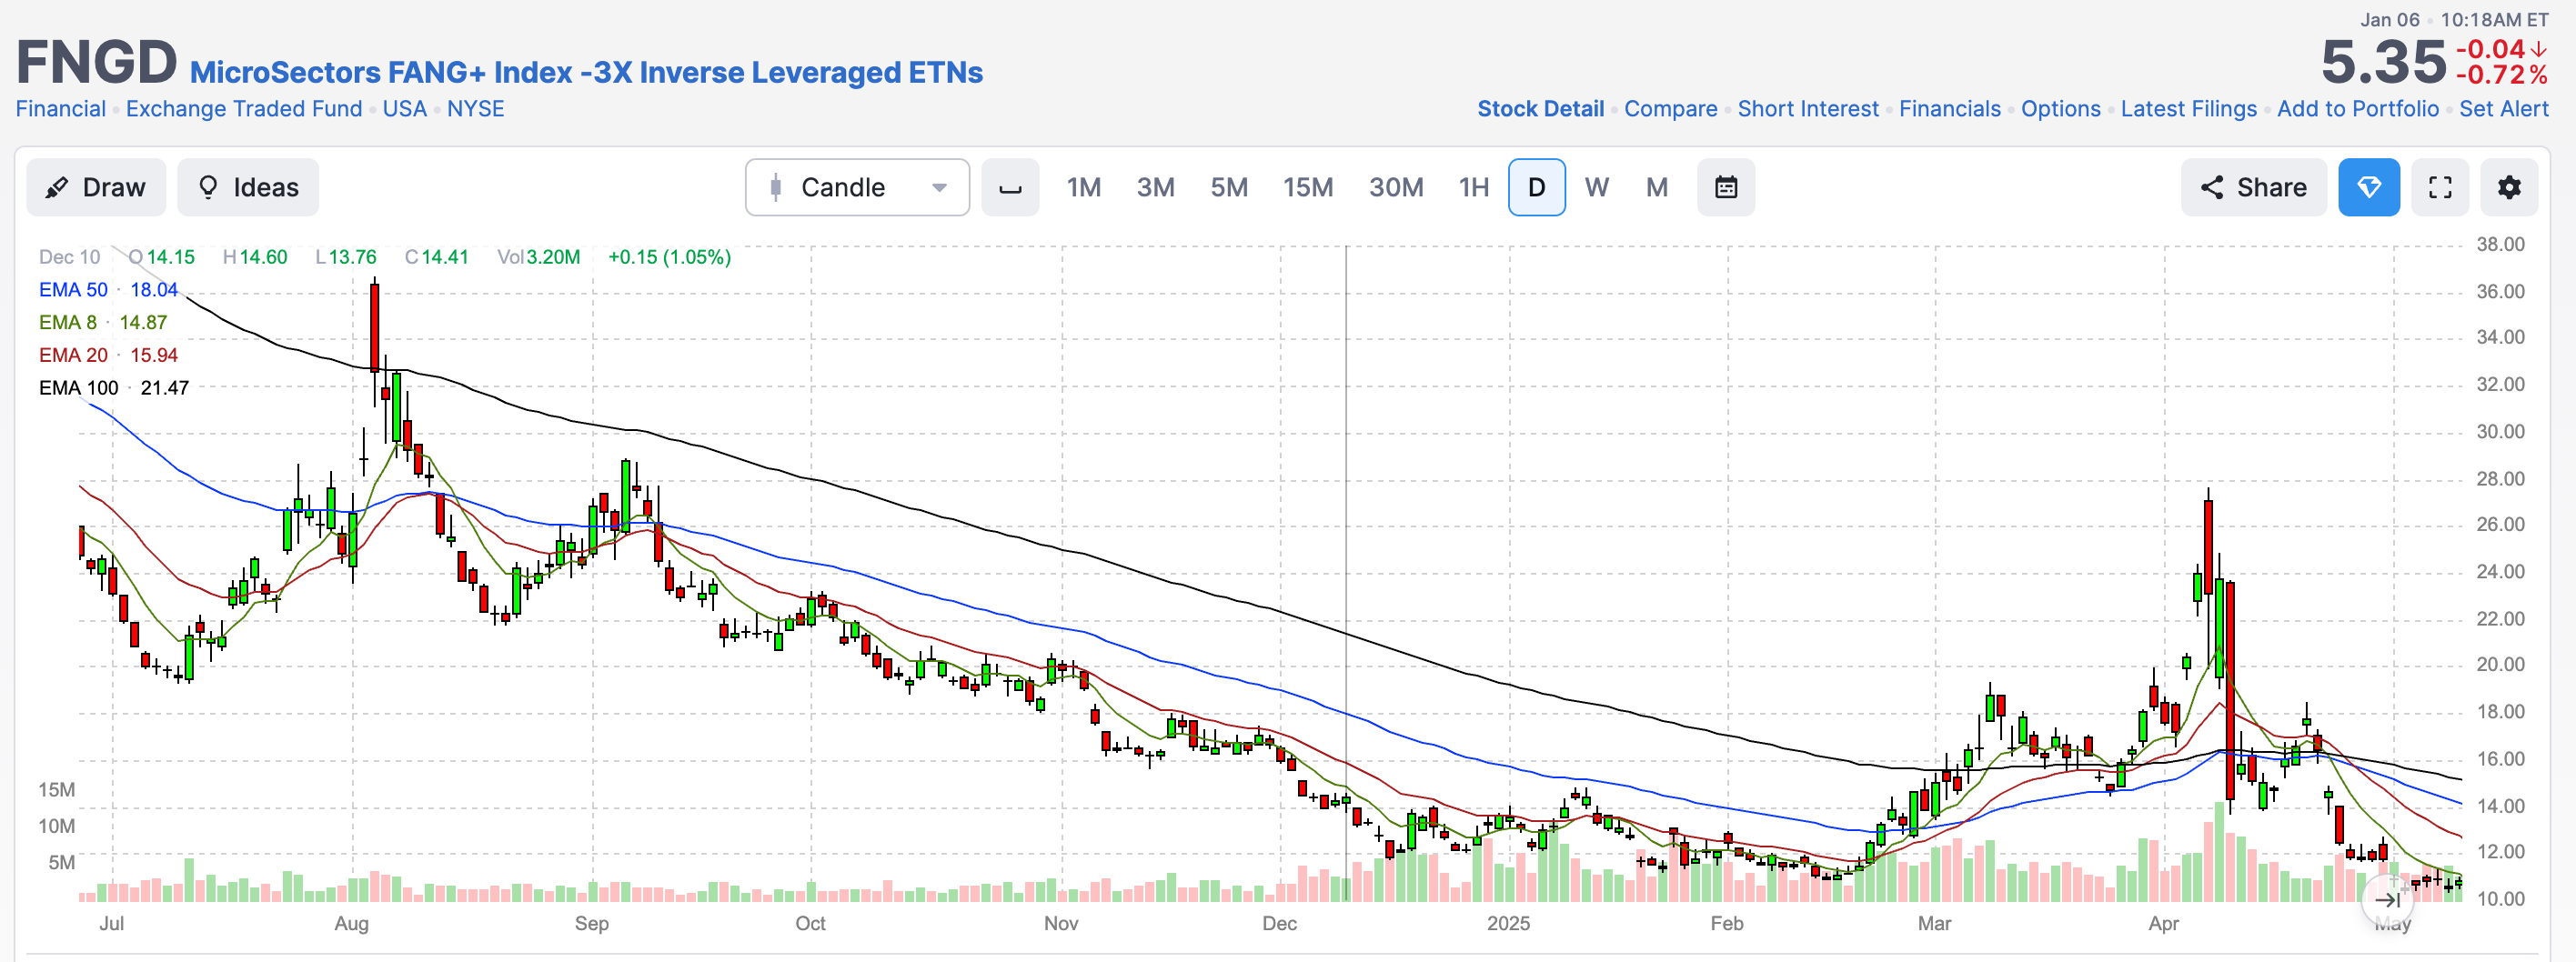
The MicroSectors FANG+ ETNs are “momentum” on steroids.
These aren’t really investments. They’re trading tools. And yes, there is decay and a few critiques of my categorization… However, let me just go back of the envelope…
FNGU gives you 3x the daily return of the biggest tech and growth names: Meta, Apple, Amazon, Netflix, Google, Nvidia, Tesla. When these stocks go up, FNGU goes up three times as much. FNGD is the opposite. It rises when those stocks fall.
But they tell you something important.
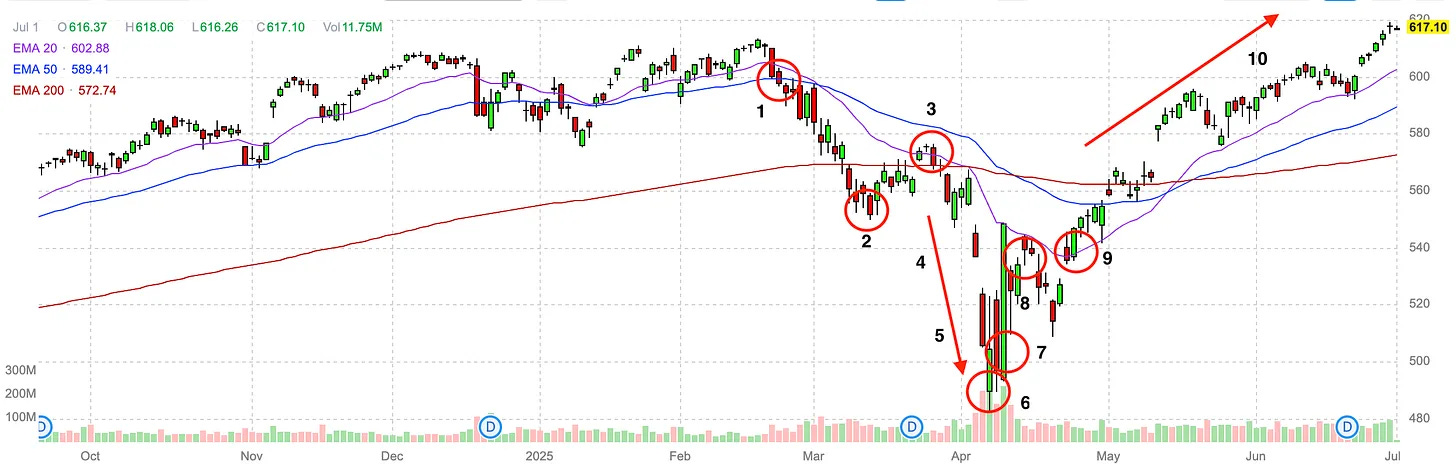
Watch what happens to FNGD during market stress… ahead of the worst headlines.

The chart above showcases two significant events that we’ve tracked and avoided in the last 18 months - the August 2024 Nikkei Crash and the April 2025 trade crash.
All of this relates to momentum, which we’ll continue to discuss.
The FNGD spikes during periods of stress, not because the Mega Cap stocks suddenly became bad businesses. But because the permission to hold risky, concentrated, momentum-driven positions evaporated.
FNGD is not a bear thesis.
It’s a liquidity and liquidation thesis.
And it’s a damn good warning signal for retail investors who don’t want to learn calculus out of one bloodshot eye at 8:35 in the morning.
Why Momentum Crashes
This is the part most momentum fans skip.
Momentum doesn’t fail randomly.
It fails when liquidity conditions change quickly, as evidenced by Asness, Moskowitz, and Pedersen, or just reading the writing and analysis we’ve done here at Me and the Money Printer as it happens.
When borrowing gets expensive or fear spikes.
When the rules for what counts as good collateral change.
When risk tolerance disappears.
Momentum crashes are not mysterious.
They are periods of selling that are triggered by disappearing liquidity. Recall, all that leverage and margin can quickly lead to deleveraging among leveraged funds.
The same persistence that fueled the trend reverses violently when the system says “no more.”
The 2020 crash is a perfect example. Leveraged funds actually started to unwind positions around February 21, 2020, and massive levels of selling and panic didn’t really kick in until mid-March of that year.
Liquidity had evaporated. The National Financial Conditions Index (NFCI) collapsed.
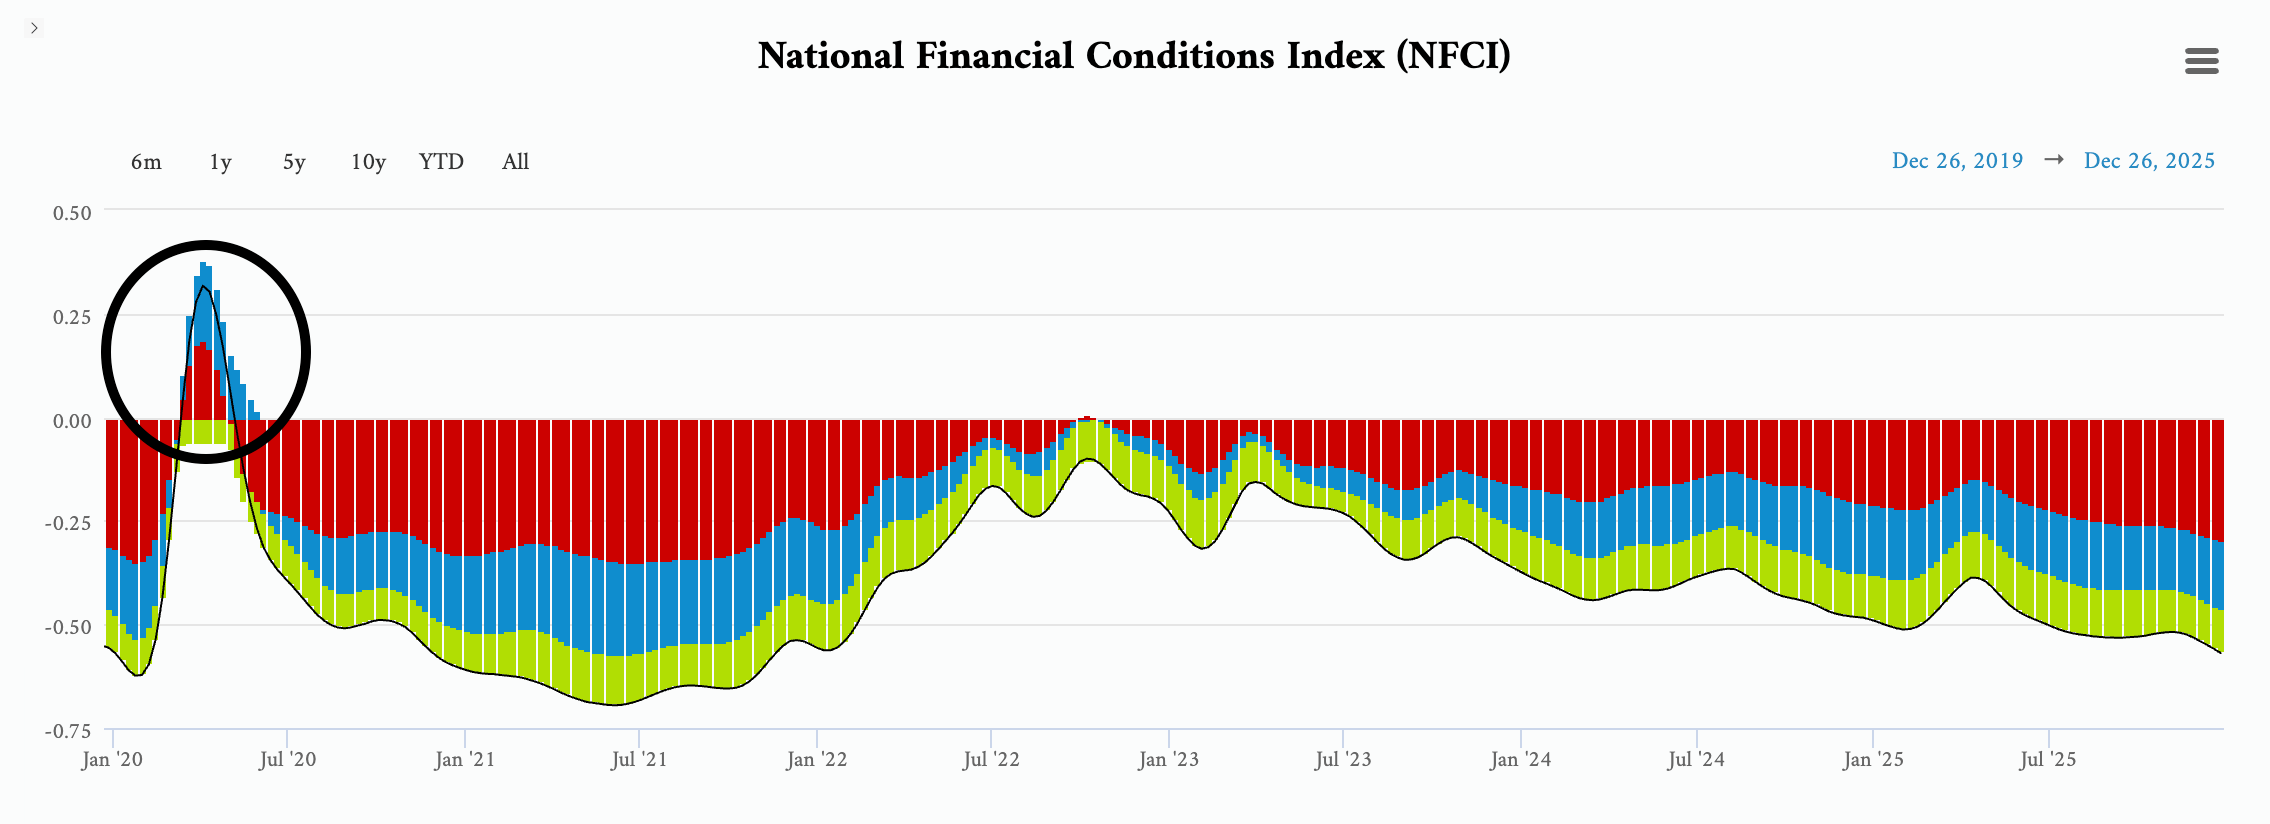
The prior winners stalled. Momentum funds got destroyed in weeks.
It wasn’t just Zombie stocks that were getting crushed. It was everything, especially the stocks used as collateral in repo markets, stocks with heavy passive flows, strong collateral quality, and highly liquid spreads.
That wasn’t a failure of momentum. It was a liquidity regime change.
Momentum doesn’t die because prices were wrong. It dies because financing disappears.
The Fed had to step in to rescue the financial system.
When they did, crushed stocks started to rebound (after the Fed announced its massive Quantitative Easing efforts). Insider buying was the strongest in real-dollar terms since the 2015-2016 China Crash.
Markets rebounded when liquidity returned in a tsunami from the COVID bailouts.
This Is What Changed My Perspective
Here’s where I part ways with generic momentum strategies.
How do we measure liquidity and momentum in real time? There are tools to do so. We looked at the NCFI above. We assess banking data and actions in repo markets.
But from a momentum perspective in equities, there wasn’t really much in the public eye before 2018.
Before 2018, most “momentum measurements” were just refinements of price itself.
People just looked at moving averages, relative strength rankings, and volatility-adjusted returns. We hear terms like trend filters and breadth overlays.
All of these things are useful, but they either lag or all live downstream.
They told you what prices were doing.
They rarely told you whether the conditions supporting those prices were still intact.
That’s like driving by watching the speedometer while ignoring the fuel gauge, the oil light, and the engine temperature.
You know how fast you’re going, but you have no idea how long you can keep going.
Which brings me to the single most consequential piece of financial literature I’ve ever encountered.
J.D. Henning at Value & Momentum Breakouts pioneered a fundamentally different approach based on his academic work. [His father is renowned value and momentum expert Dr. Grant Henning, author of Trading Stocks by the Numbers: Financial Engineering for Profit, and the Value and Momentum Trader]
J.D. Henning’s 300-page dissertation, Multiple Discriminant Analysis of the Price Momentum Anomaly and Reversal Event Signals, is, in my view, the most important trading-focused financial paper written in the post-2008 period.
Henning didn’t ask which stocks were going up.
He asked whether the market environment could sustain momentum.
The tools he built, called Momentum Gauges, don’t track price trends.
They track conditions.
Are funds flowing into equities or out? Is participation broad or narrow? Is fear rising or dissipating? Are internal pressures building beneath the surface even as prices grind higher?
These are the questions that retail investors (yeah, pros too) need to avoid the continued head-banging.
This was a simpler but different framework from where most momentum academics had operated in the past.
The bulk of the performance analysis is conducted at the edges of bell curves.
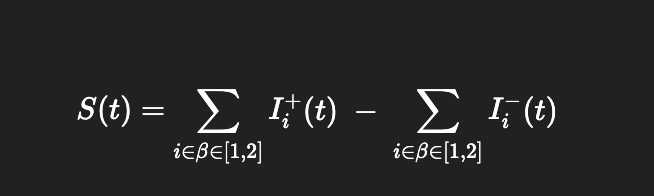
For Henning, all of that collapses into a single equation. Not a narrative. Not a survey.
Not a sentiment poll.
An equation. Number of breakout stocks minus the number of breakdown stocks… based on very specific conditions of stock movements.
That matters because equations are replicable.
This isn’t social science. It isn’t a guess. You don’t start with the answer you want and work backwards. It isn’t storytelling dressed up as rigor.
It’s finance with the spine of physics.
If you have the inputs, you get the same output. It can’t be faked.
And that framework, outlined in his dissertation and carried forward into his system, has flagged major market corrections before they happened (the dataset lines up).
This isn’t about predicting tops or bottoms. It’s about showing when the internal conditions that sustain momentum begin to break down.
This acts like a diagnostic.
What’s especially interesting, and I don’t think Henning explicitly framed it this way, is how closely his internal measures align with Michael Howell’s liquidity framework.
When you lay them on top of each other, you get something powerful: a macro-to-micro momentum waterfall that can soon incorporate other important elements to increase the success of predicting reversals, tops, bottoms, and short squeezes.
The waterfall framework I’ve structured has allowed me, as a financial journalist first and an economist second, to recognize that the market is facing a possible reversal event.
Not because it predicts outcomes, but because it narrows the field of where to look.
I can quickly start investigating why stress is building in the financial markets.
Henning asks whether the market is healthy, and the answer is binary: yes or no.
That’s a valuable question. But it leads to the next ones.
We ask whether that health is improving or deteriorating right now and when periods of health or deterioration are overstretched. And we ask where the stress lives and what sorts of patterns and events we can anticipate from market reversals and deep liquidity downturns.
Things like: the same sell-off pattern that has emerged repeatedly since COVID.
The Money Printer Framework
Our framework draws on ideas that have proven effective over time.
Joel Greenblatt proved that simple, repeatable systems can outperform gut feel.
Fama and French documented that certain patterns recur across markets.
Asness, Moskowitz, and Pedersen showed us to focus on cheap capital, calm markets, wide credit availability, and easing risk conditions.
Meb Faber helped popularize the idea that trends and regimes matter over full cycles.
And JD Henning demonstrated that market health can be measured in real time.
We agree with all of that.
We’re just looking for new ways to use this information for investors of all stripes.
Instead of building a complex model around those ideas, we asked a simpler question:
Are the conditions that support trends getting stronger or weaker right now?
That’s it, across the Russell 2000, Nasdaq 100, and S&P 500.
Not why markets should move.
Not what markets ought to do.
Whether the environment is becoming more supportive or more fragile.
It requires a simple starting point.
Yes, we can reduce this to an introductory equation.
At its core, it’s an assessment of:
monthly and weekly performance,
combined with basic beta and participation measures.
That gives us a first read on momentum health, not just momentum direction.
From there, we layer in context.
We ask:
Are markets overbought or oversold?
Are insiders buying or selling in size?
Are breakouts expanding, or are breakdowns quietly increasing?
Are public policy decisions adding fuel or taking it away?
Is there structural pressure that could lead to a squeeze?
This is how we identified several key squeeze dynamics in 2025, including the March 12 to March 26 move.
And why the more recent upside burst was closely tied to Japan’s stimulus package.
Stress First. Response Second.
Once stress begins to form, the next question matters more than prediction:
Where should we be looking?
If conditions are deteriorating, we want to know:
whether policy responses are likely,
what policy responses are happening right now
where aren’t we looking and what data limitations do we have
where liquidity relief would come from,
and how markets typically behave when that relief arrives.
That framework enabled us to recognize the conditions surrounding the April selloff and respond quickly when liquidity returned.
Markets jumped off the mat on April 9.
Momentum fully re-engaged when the S&P 500 reclaimed its short-term averages in late April.
Again: liquidity, permission, momentum.
What This Is (and Isn’t)
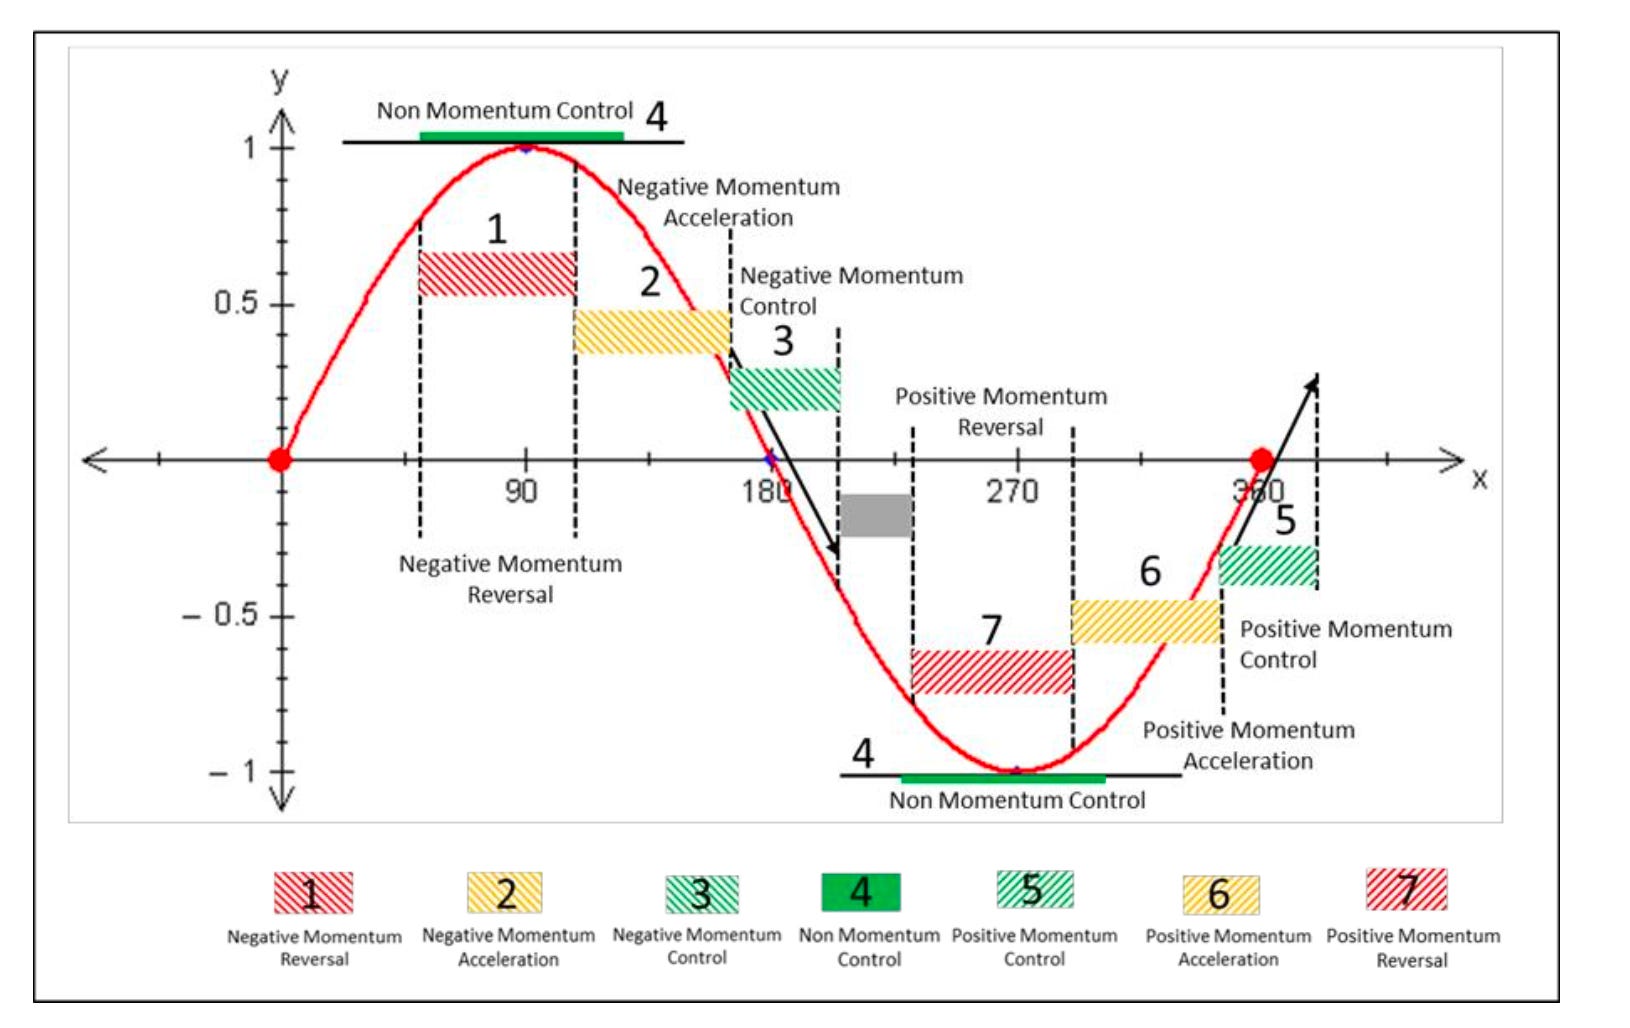
I’m not trying to overexplain markets.
I’m trying to identify where we are on the curve, estimate the probability of continuation or reversal using simple technical indicators, and help traders act with confidence rather than react emotionally.
We take established ideas and boil them down into something usable.
Not a model that requires calculus.
Not a narrative that changes every week.
A real-time confidence signal that looks like it was built in Excel… because it was.

How We Use It
We focus less on labels and factors and more on:
changes,
acceleration,
participation,
and key technical levels.
We use tools like FNGD because they concentrate liquidity, leverage, and momentum into one place, making stress visible early.
We watch whether participation is expanding or contracting.
Whether leadership is broadening or narrowing.
That change in pace is where liquidity reveals itself, and where trends either persist or break.
You can think of this framework as a practical layer built on top of existing work.
We don’t add more theory.
We make the theory actionable.
And most importantly, we use it to help traders play defense first, so they don’t get caught inside liquidity events they never saw coming.
Momentum Is a Feature of the Money Printer
So far, we’ve discussed momentum as a market behavior.
This is the deeper layer.
Momentum is not a strategy layered on top of markets.
It’s a byproduct of the monetary system itself.
When liquidity flows consistently, winners keep attracting capital, losers keep losing access, prices trend, and narratives form after the move.
When liquidity stutters and momentum stalls, leaders crack.
Then correlations spike and exits get crowded.
That’s the cycle.
When a fund manager beats the market, investors give them more money.
The manager deploys that money in the same stocks that made them successful.
Those stocks rise further, more investors pile in, more flows continue.
Passive investing amplifies this cycle.
Index funds automatically allocate more money to stocks that have risen (because those stocks now have a larger weight in the index).
A 2017 research paper by Neuberger Berman’s Genesis Small-Cap Equity team called this “a self-fulfilling price momentum loop” that “ebbs and flows with the capital markets cycle, which in turn is heavily influenced by monetary policy.”
In other words, Fed and Treasury policy shape fund flows.
Fund flows create momentum, and momentum persists until liquidity changes.
This is why momentum always leads fundamentals.
Liquidity moves first.
Momentum follows.
Earnings come later.
Always.
What Momentum Really Tells You
Momentum is not telling you what’s “good.”
It’s telling you what the system is currently willing to tolerate.
Can the market withstand high valuations, low margins, rampant speculation, and increased concentration right now?
Momentum doesn’t care.
As long as liquidity persists, momentum persists.
When it doesn’t, nothing else matters.
This is why watching FNGD matters.
When it spikes, it’s not a signal that big tech is broken.
It’s a signal that the permission structure that allowed those stocks to trend is unwinding.
The fundamentals didn’t change. The plumbing has.
Take August 2024, NVIDIA lost 33% of its share value in about three weeks.
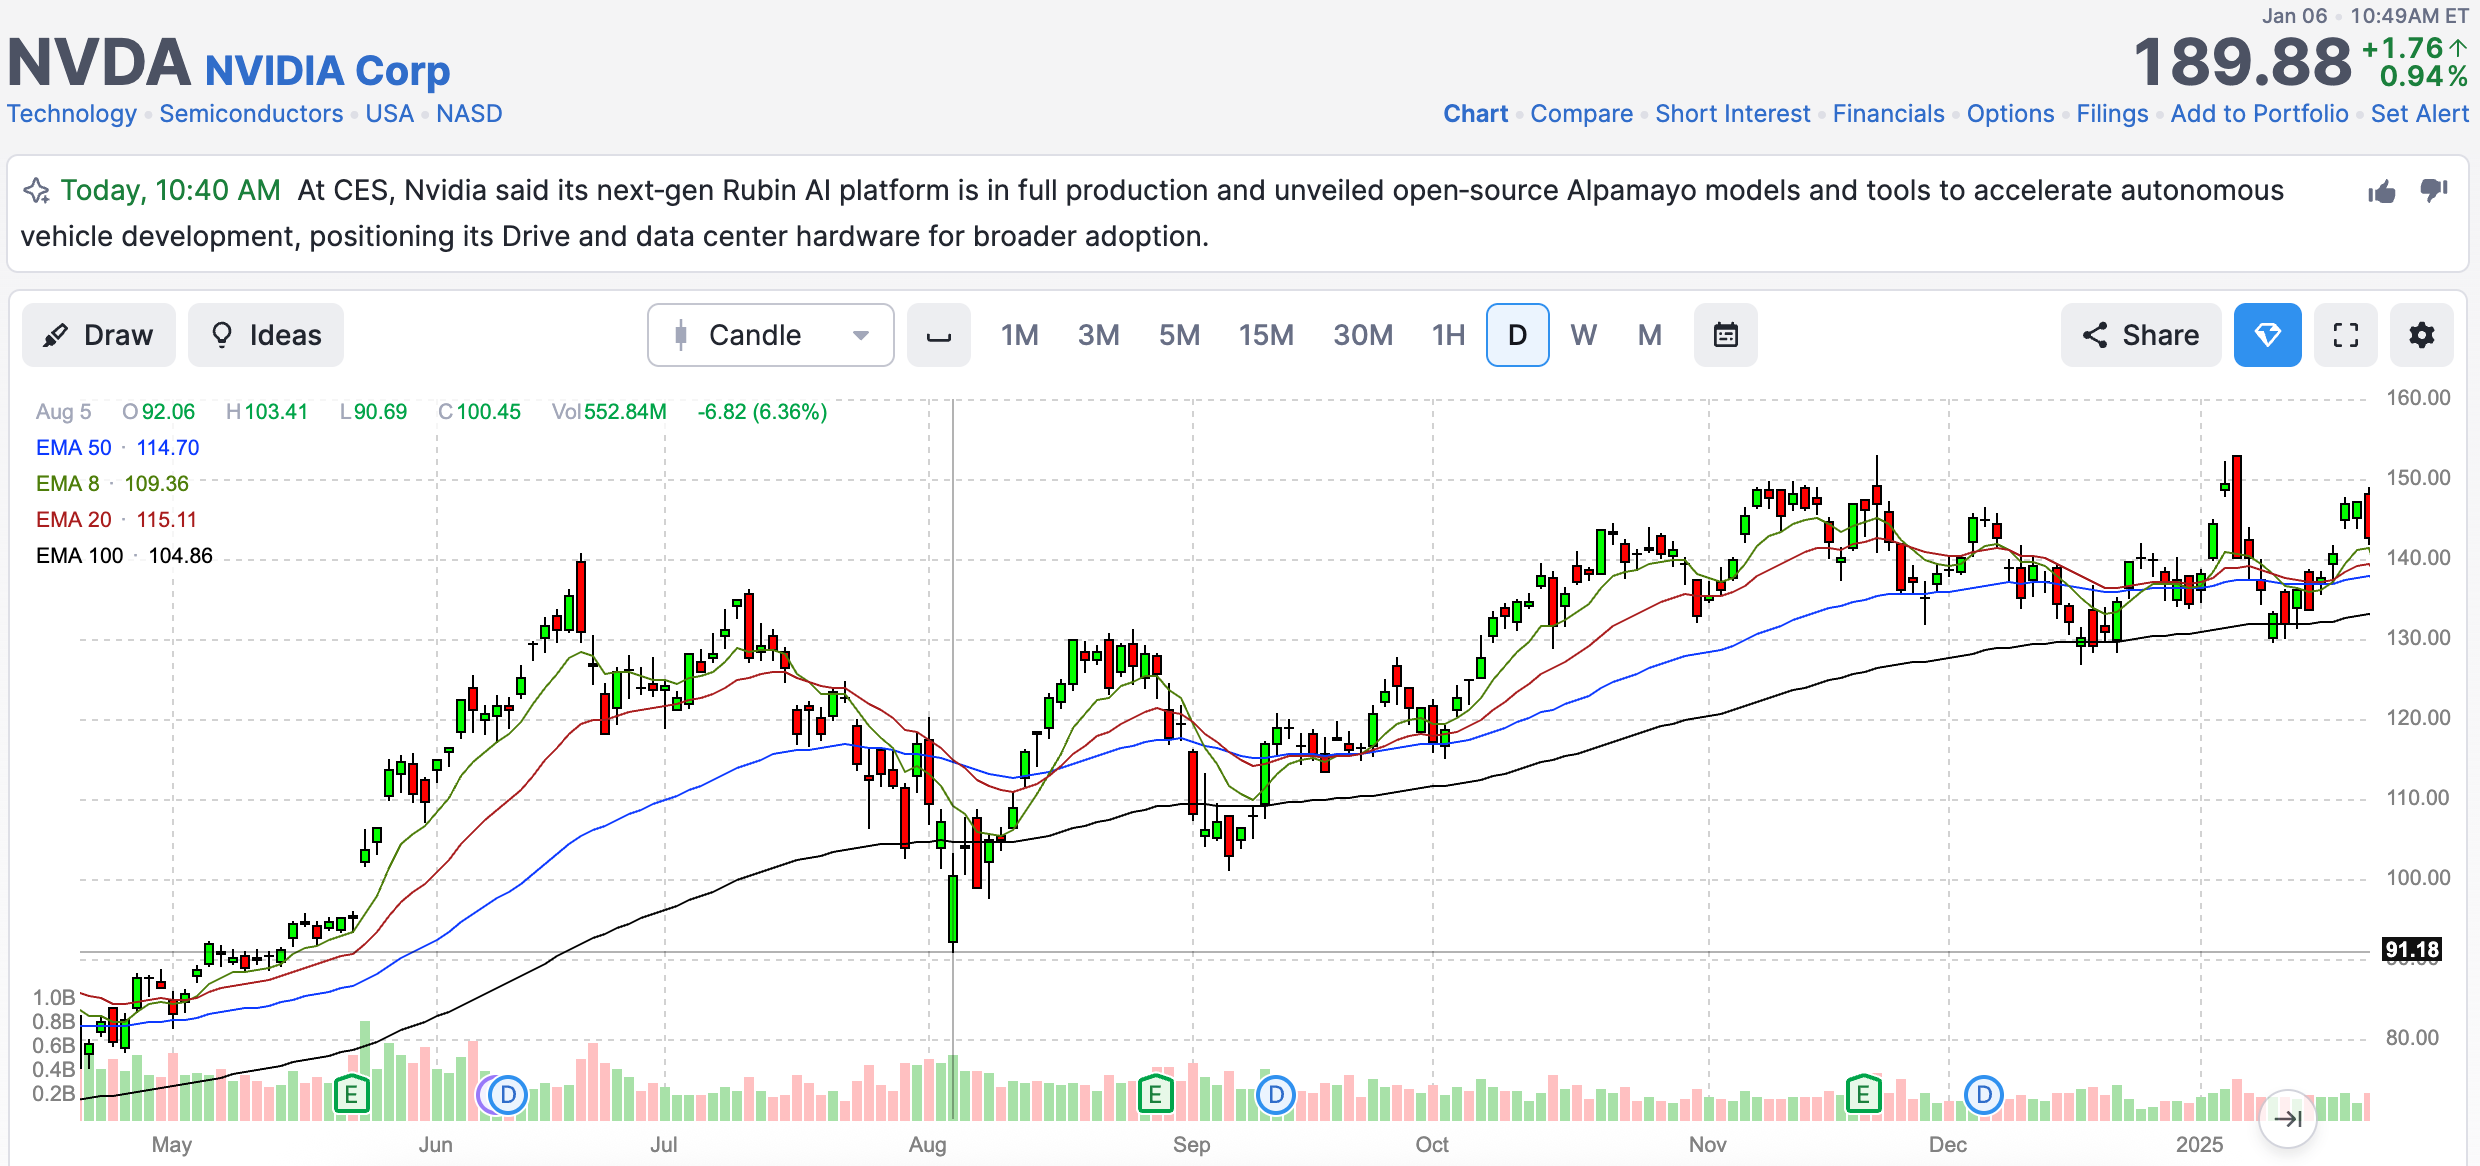
The thesis for NVIDIA didn’t change.
It was still the top chip player in the game. It was still the largest company in the world. It was still at the top of the S&P 500 weight and still at the top of more than 1,300 ETFs.
What changed in August 2024?
Japan.
The Nikkei had its worst one-day decline since 1987 due to concerns about inflation, rising rates, and the health of the carry trade.
When the Bank of Japan provided subtle forward guidance, permission returned.
Markets stabilized. Momentum resumed.
In the financial markets.
Liquidity is the cause. Momentum is the expression. Returns are the result.
Momentum doesn’t predict the future.
It tells you how long the present can last.
Stay positive,
Garrett
PS: In Money Printer 103, we’ll walk through how insider buying works as a timing tool.
Sources
Source 1: Returns to Buying Winners and Selling Losers: Implications for Stock Market Efficiency Author(s): Narasimhan Jegadeesh and Sheridan Titman Source: The Journal of Finance, Vol. 48, No. 1 (Mar., 1993), pp. 65-91
Source 2: On Persistence in Mutual Fund Performance, Author: Mark M. Carhart https://onlinelibrary.wiley.com/doi/10.1111/j.1540-6261.1997.tb03808.x
Source 3: The Role of Central Bank Policy in Small-Cap Active Manager Performance Cycles, Authors: Neuberger Berman, Genesis Small-Cap Equity Team. 2017
Tim gifs on point
This was a fantastic read! Am eager to read up on the references as well. Am just getting familiar with this type of analysis and I love it!